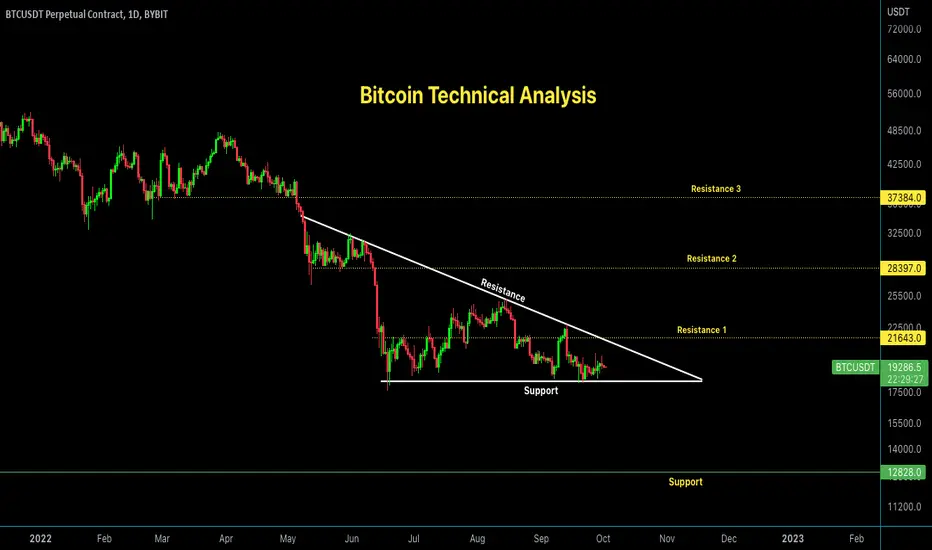
#Bitcoin Technical Analysis:-
 BTC currently trading at $19300 Level.
As Per chart We can see Descending Triangle is Forming in BTC daily Chart.
As Per chart Ruls it is bearish and Maximum times it Breakout below side.
But Never Follow Blindly always wait for Confirmation imo.
So As Per chart if Break down $18000 Level then we can see $12800 Level.
But If break out Upward side and Cross $21600 Level then we can see $28400
Never forget to Placed stop Loss if open any Scalp Trade.
Support:- $18,000/$13,000
Resistance:- $28400/$37400
BTC currently trading at $19300 Level.As Per chart We can see Descending Triangle is Forming in BTC daily Chart.
As Per chart Ruls it is bearish and Maximum times it Breakout below side.
But Never Follow Blindly always wait for Confirmation imo.
So As Per chart if Break down $18000 Level then we can see $12800 Level.
But If break out Upward side and Cross $21600 Level then we can see $28400
Never forget to Placed stop Loss if open any Scalp Trade.
Support:- $18,000/$13,000
Resistance:- $28400/$37400

Twitter: twitter.com/CryptoPatel
Telegram: t.me/OfficialCryptoPatel
Instagram: instagram.com/cryptopatel?utm_medium=copy_link
Telegram: t.me/OfficialCryptoPatel
Instagram: instagram.com/cryptopatel?utm_medium=copy_link
相关出版物
免责声明
这些信息和出版物并非旨在提供,也不构成TradingView提供或认可的任何形式的财务、投资、交易或其他类型的建议或推荐。请阅读使用条款了解更多信息。