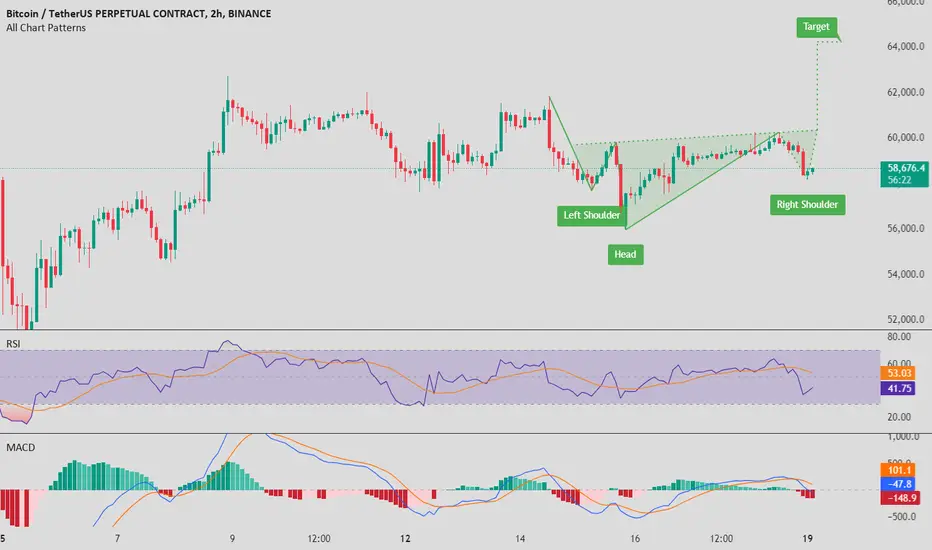
This 2-hour  BTC chart is showing a classic inverse head and shoulders pattern, which typically signals a bullish reversal. We can see that the right shoulder is currently forming, and if the pattern plays out, the price target could be around $64,000. The RSI has dipped below the midline, indicating a brief pullback, but it’s still in a healthy range. The MACD is in a bearish phase, but it could be signaling a potential bottom. Keep an eye on the neckline around $59,000; if BTC can break above that, it could confirm the bullish move.
免责声明
这些信息和出版物并非旨在提供,也不构成TradingView提供或认可的任何形式的财务、投资、交易或其他类型的建议或推荐。请阅读使用条款了解更多信息。
免责声明
这些信息和出版物并非旨在提供,也不构成TradingView提供或认可的任何形式的财务、投资、交易或其他类型的建议或推荐。请阅读使用条款了解更多信息。