
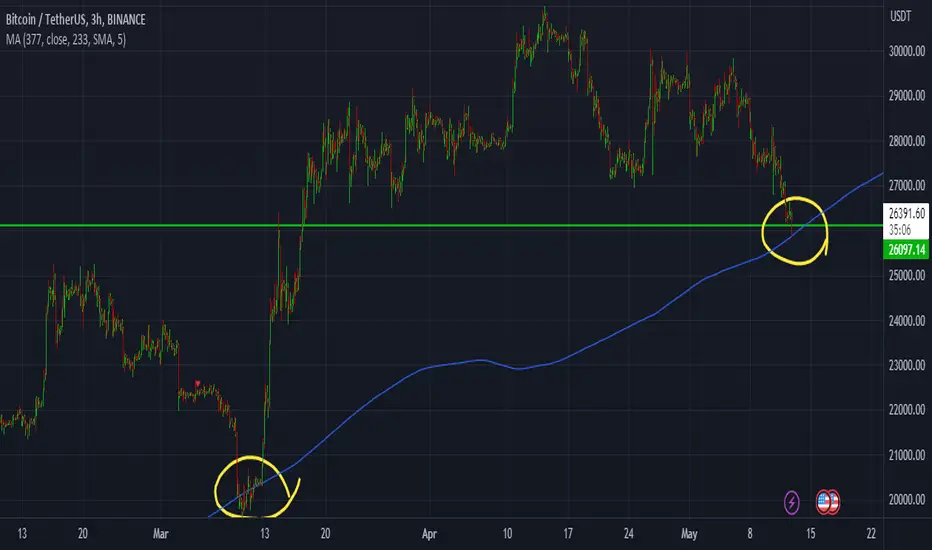
377ma offset 233 - this line is perhaps the best moving average out there based on my experience and we had a bounce on it once more. Last time it marked the bottom at 19-20k and I am hoping it marks the new bottom here.
If you plot this MA and observe the BTC chart on the 3h, you will see its significance. I dont know why it works I just know it is one of the most significant lines in crypto - above it = bullish, below it - bearish. It works on every timeframe and sometimes you have to change timeframe to see which one is relevant for the moment, at least thats how I use it.
Since its such a macro moving average, it has a lot of information in it and it is even significant on the 1 minute chart for breakouts/breakdowns or failed breakouts/breakdowns.
So, long story short, I think its time to long!
If you plot this MA and observe the BTC chart on the 3h, you will see its significance. I dont know why it works I just know it is one of the most significant lines in crypto - above it = bullish, below it - bearish. It works on every timeframe and sometimes you have to change timeframe to see which one is relevant for the moment, at least thats how I use it.
Since its such a macro moving average, it has a lot of information in it and it is even significant on the 1 minute chart for breakouts/breakdowns or failed breakouts/breakdowns.
So, long story short, I think its time to long!

免责声明
这些信息和出版物并非旨在提供,也不构成TradingView提供或认可的任何形式的财务、投资、交易或其他类型的建议或推荐。请阅读使用条款了解更多信息。
免责声明
这些信息和出版物并非旨在提供,也不构成TradingView提供或认可的任何形式的财务、投资、交易或其他类型的建议或推荐。请阅读使用条款了解更多信息。