
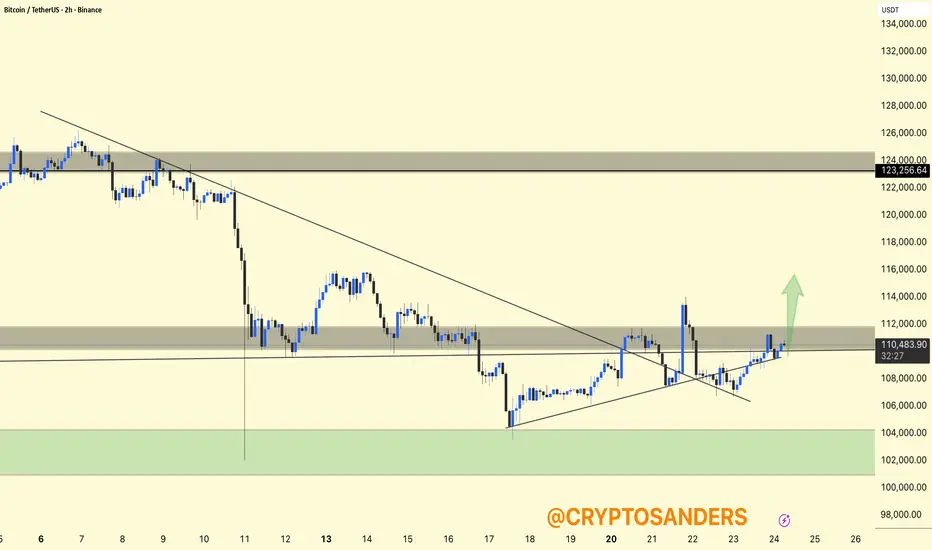
BTCUSDT Chart Analysis (2H).
Breakout: BTC has broken its descending trendline and reclaimed the $110,000 resistance area. Bulls are pushing the price towards the upper side of the supply zone marked around $112,000.
Setup: If BTC maintains a price above $110,000, the chart forecasts further upside, with the next resistance level at $115,000-$117,000.
Caution: Support is at $108,000-$110,000; losing this level could risk a retracement to $106,000-$104,000.
DYOR | NFA
Breakout: BTC has broken its descending trendline and reclaimed the $110,000 resistance area. Bulls are pushing the price towards the upper side of the supply zone marked around $112,000.
Setup: If BTC maintains a price above $110,000, the chart forecasts further upside, with the next resistance level at $115,000-$117,000.
Caution: Support is at $108,000-$110,000; losing this level could risk a retracement to $106,000-$104,000.
DYOR | NFA

相关出版物
免责声明
这些信息和出版物并非旨在提供,也不构成TradingView提供或认可的任何形式的财务、投资、交易或其他类型的建议或推荐。请阅读使用条款了解更多信息。