BTC DETAILED ANALYSIS
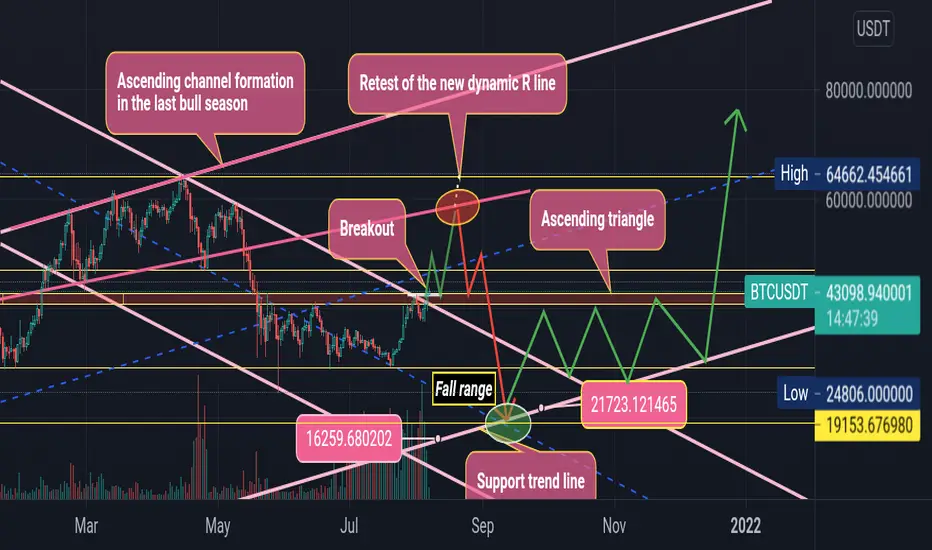
Btc continues to follow the predictions on my previous chart which insinuates short term bullish and long term bearish. Yesterday, BTC broke out of the descending trendline analysed from the previous ATH and this clearly show sign of bulls in short term to the previous highs. Considering a break from the descending channel, does that insinuate a reversal trend back to bticoin's ATH at $64.5k, well that's probable if only btc can break into the ascending channel formation at the last bull season. My expectation is a kiss at the higher low of the channel then we'll be back to bear season but that'll be sad. You can checkout my full chart analysis of "BTC SHORT TERM BULLISH & LONG TERM BEARISH" in related ideas at the bottom page.
Your likes and opinions would be much appreciated, you can follow up for more helpful contents and do follow my comment sections too for quick updates.
Your likes and opinions would be much appreciated, you can follow up for more helpful contents and do follow my comment sections too for quick updates.

免责声明
这些信息和出版物并非旨在提供,也不构成TradingView提供或认可的任何形式的财务、投资、交易或其他类型的建议或推荐。请阅读使用条款了解更多信息。