
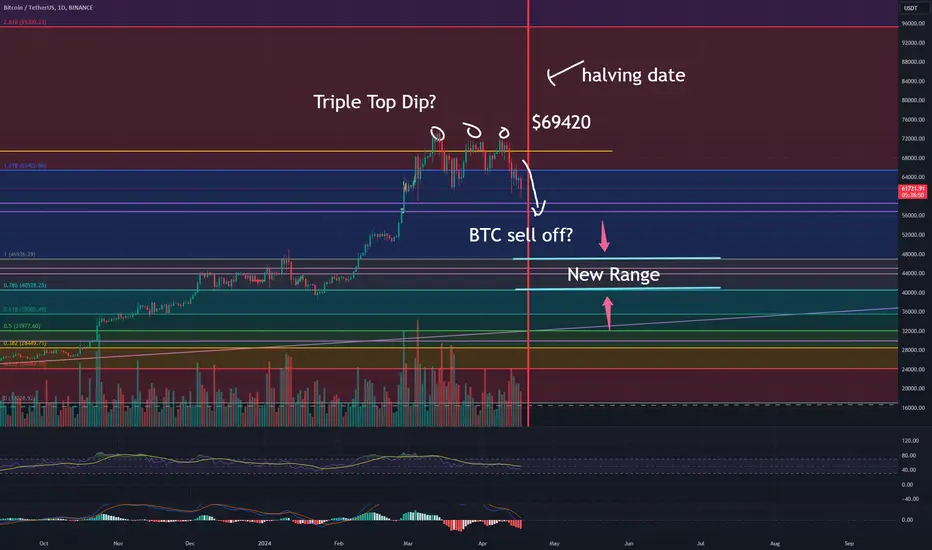
We've hit a triple top pattern and since have been dipping, only days before the halving event. The halving event can be seen in the vertical line in red. I believe this is an indication that investors have begun selling off some BTC prior to the actual event.
We have also strayed far from the ultimate $69,420 major support/resistance line. At this distance away from the support line, this indicates looking for a new support/resistance range.
On sell-off date, we may see a false alarm green, followed by red over a long period of time. Historically, the exact halving events of the past haven't had bullish runs immediately after.
The fib lines you see begin from the beginning of this cycle's bull run, to a long standing support line near previous peaks, where fib line "1" is $46,926.
My new range expectation is between $40,528 to $46,926. Between fib lines 0.786 and 1 for the near month or so.
Personally, I have sold a little over 65% of my BTC portfolio in the last couple weeks. Hanging on to the other 45% to hedge against my prediction. Will buy back if prediction is correct and finds a new, solid support.
Tl:dr: bearish in the 0-3 month range, bullish in the 3-6+ month range.
We have also strayed far from the ultimate $69,420 major support/resistance line. At this distance away from the support line, this indicates looking for a new support/resistance range.
On sell-off date, we may see a false alarm green, followed by red over a long period of time. Historically, the exact halving events of the past haven't had bullish runs immediately after.
The fib lines you see begin from the beginning of this cycle's bull run, to a long standing support line near previous peaks, where fib line "1" is $46,926.
My new range expectation is between $40,528 to $46,926. Between fib lines 0.786 and 1 for the near month or so.
Personally, I have sold a little over 65% of my BTC portfolio in the last couple weeks. Hanging on to the other 45% to hedge against my prediction. Will buy back if prediction is correct and finds a new, solid support.
Tl:dr: bearish in the 0-3 month range, bullish in the 3-6+ month range.
注释
It looks like immediately after halving, we had a cup handle formation, followed by a clean channel upward, filling the gap. Certainly not what I was expecting. 
免责声明
这些信息和出版物并非旨在提供,也不构成TradingView提供或认可的任何形式的财务、投资、交易或其他类型的建议或推荐。请阅读使用条款了解更多信息。
免责声明
这些信息和出版物并非旨在提供,也不构成TradingView提供或认可的任何形式的财务、投资、交易或其他类型的建议或推荐。请阅读使用条款了解更多信息。