
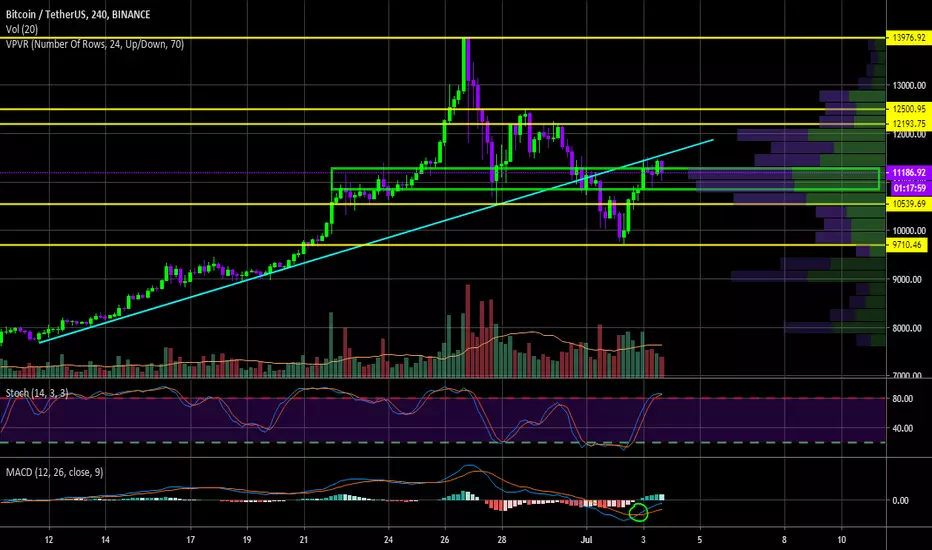
Trend line started on June 11th as support (light blue line) and didn't break down until the 30th of June. This is where the trend line flipped from support to resistance. Currently bouncing off of the resistance now. VPVR area showing larger buy/sells in the area marked by the green box, would like to close today over this level. Also, looking at the 4hr MACD (green circle) cross, which is bullish. Looking for the stoch rsi to take a dip and then cross bullish again on a push up. MAJOR SUPPORT=$9,700 and MAJOR RESISTANCE=$12,500, looking for a 4hr equilibrium to form and play out. However, we all know that BTC can produce some violent moves up or down and may not produce the equilibrium pattern we are looking for (could blow past or below these areas). Leaning towards another bullish push if we can break back above long term trend line (light blue line). Stay safe out there!
注释
Breaking above our trend line, lets see if we can hold it. Strong move so far!
免责声明
这些信息和出版物并非旨在提供,也不构成TradingView提供或认可的任何形式的财务、投资、交易或其他类型的建议或推荐。请阅读使用条款了解更多信息。