
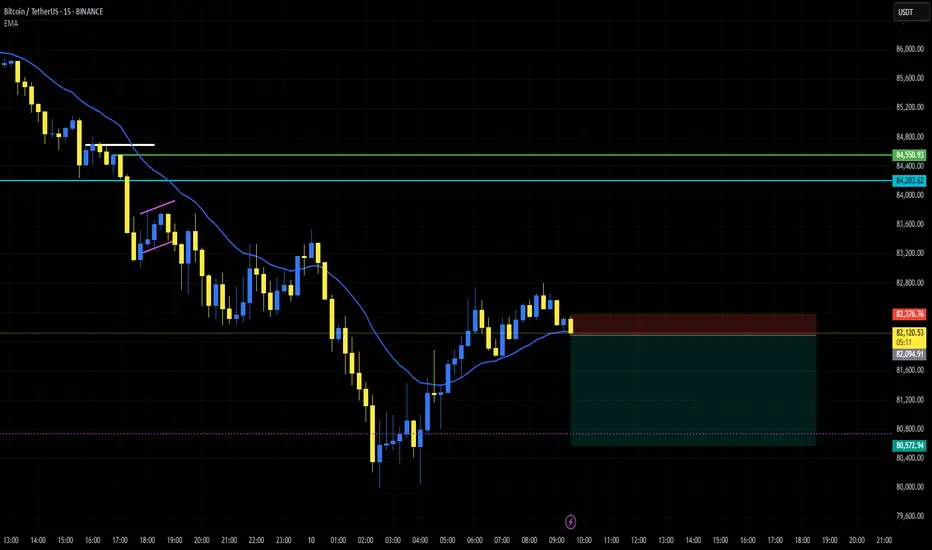
📉 **BTCUSDT Analysis – Bearish Structure on the 15-Minute Timeframe**
The chart indicates a strong downtrend in the 15-minute timeframe. After a continuous decline, the price is attempting a recovery, but this move appears to be more of a correction within the bearish trend. The price has shown weakness after touching the Exponential Moving Average (EMA), increasing the likelihood of further downside movement.
🔹 **Entry Level:** 82,205.98
🔹 **Stop Loss:** 82,376.76
🔹 **Final Target:** 80,572.94
**Key Levels:**
🔸 **Major Support:** 80,572.94
🔸 **Major Resistances:** 84,203.62 and 84,550.93
💡 Paying attention to the overall market trend and price reactions to key levels is crucial. In this strategy, **half of the trade volume should be closed at TP1** to secure profits and manage risk effectively.
The chart indicates a strong downtrend in the 15-minute timeframe. After a continuous decline, the price is attempting a recovery, but this move appears to be more of a correction within the bearish trend. The price has shown weakness after touching the Exponential Moving Average (EMA), increasing the likelihood of further downside movement.
🔹 **Entry Level:** 82,205.98
🔹 **Stop Loss:** 82,376.76
🔹 **Final Target:** 80,572.94
**Key Levels:**
🔸 **Major Support:** 80,572.94
🔸 **Major Resistances:** 84,203.62 and 84,550.93
💡 Paying attention to the overall market trend and price reactions to key levels is crucial. In this strategy, **half of the trade volume should be closed at TP1** to secure profits and manage risk effectively.

免责声明
这些信息和出版物并非旨在提供,也不构成TradingView提供或认可的任何形式的财务、投资、交易或其他类型的建议或推荐。请阅读使用条款了解更多信息。
免责声明
这些信息和出版物并非旨在提供,也不构成TradingView提供或认可的任何形式的财务、投资、交易或其他类型的建议或推荐。请阅读使用条款了解更多信息。