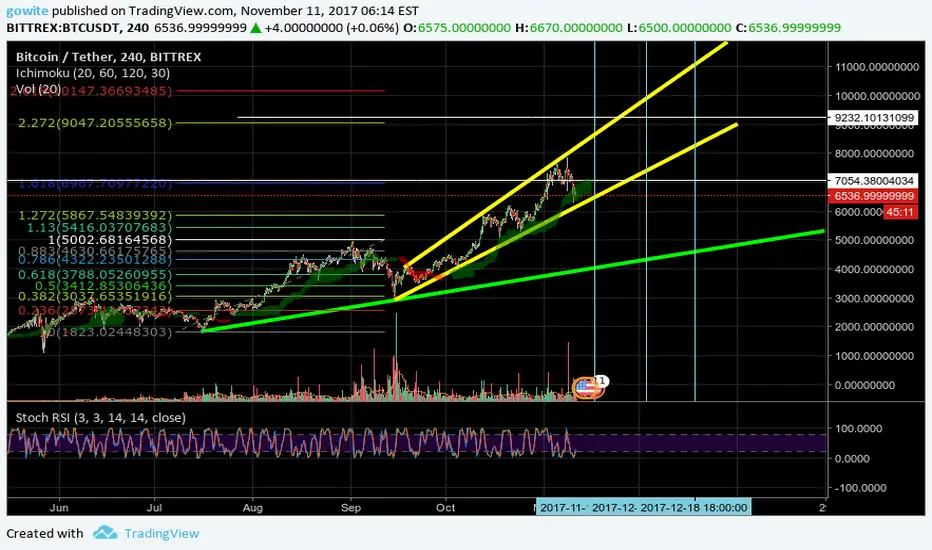
BTC followed a correction around 1.618 fib line, at least, it didn't sold under support line.
It is still in support zone. At this value, 500 usdt drops are not something huge in percentage.
The next zones that can will possibly encounter resistance are fibs 2.272-2.618 and especially 3.618.
It seems that momentum is also shaking, so it's a risky area.
If it sells under yellow support line, it can go down as more as red support line shows.
Blue lines indicate possible downtrend start days.
Remember hope for the best and prepare for the worst.
It is still in support zone. At this value, 500 usdt drops are not something huge in percentage.
The next zones that can will possibly encounter resistance are fibs 2.272-2.618 and especially 3.618.
It seems that momentum is also shaking, so it's a risky area.
If it sells under yellow support line, it can go down as more as red support line shows.
Blue lines indicate possible downtrend start days.
Remember hope for the best and prepare for the worst.

免责声明
这些信息和出版物并非旨在提供,也不构成TradingView提供或认可的任何形式的财务、投资、交易或其他类型的建议或推荐。请阅读使用条款了解更多信息。