
Hello, traders!
Follow us to get the latest updates quickly.
Have a great day!
-------------------------------------
(BTCUSDT 1D Chart)
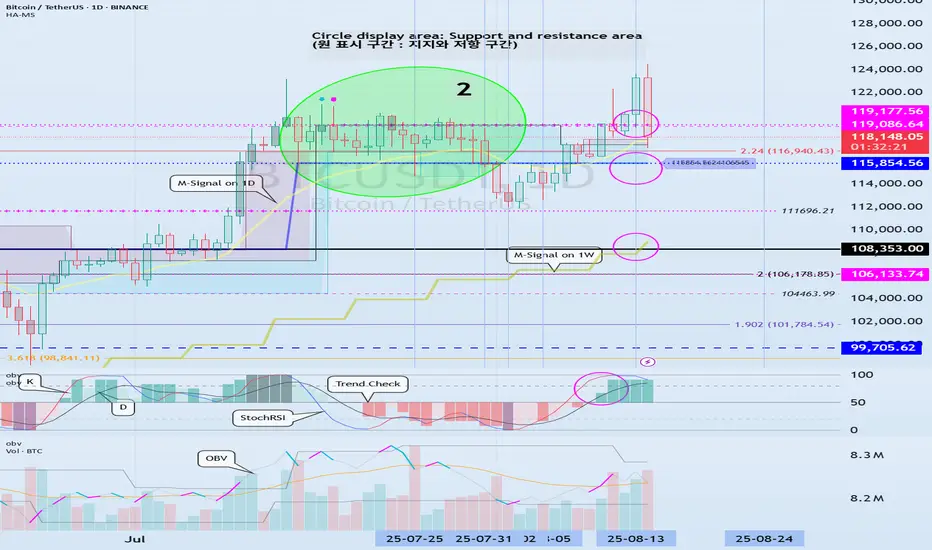
After this volatility period, the price has re-entered the 115854.56-119177.56 range.
Accordingly, the key question is whether the price can rise after finding support in the 115854.56-119177.56 range.
The next volatility period is around August 24th (August 23rd-25th).
----------------------------------------
To determine the volatility period, support and resistance points and trend lines must be drawn on each timeframe chart.
Support and resistance points are drawn using the DOM(60), HA-High, HA-Low, and DOM(-60) indicators included in the HA-MS indicator.
Trend lines are drawn by connecting the points where the K value of the StochRSI indicator forms peaks in overbought or oversold zones.
Therefore, the trend line is drawn by connecting the peaks formed in overbought zones with a high trend line and the peaks formed in oversold zones with a low trend line.
If these two trend lines form a channel, the trend is likely to continue. If the trend lines intersect, a new trend is likely to be created.
(1M Chart)
The trend lines on the 1M chart are not specifically distinguished between high and low trend lines, but are instead displayed in a single color.
This is because we determined that distinguishing between them is unnecessary, as they represent long-term trends.
When creating trend lines, you must use peaks created in overbought or oversold areas.
The 1M chart displays a dotted trend line, which connects points in overbought or oversold areas that do not have peaks.
These trend lines are not used to determine periods of volatility.
(1W Chart)
Draw support and resistance points and trend lines on the 1W chart, just like on the 1M chart.
When possible, draw trend lines only from recently created peaks and delete previously drawn trend lines.
(1D Chart)
Draw support and resistance points and trend lines on the 1D chart, just like on the 1M and 1W charts.
The points where these support and resistance points and trend lines intersect or intersect are used to identify periods of volatility.
When possible, areas where multiple support and resistance points and trend lines intersect or intersect are considered periods of high volatility.
Also, since trend lines on 1M > 1W > 1D charts differ in accuracy, it's best to select points where they intersect more frequently when utilizing trend lines drawn on 1D charts.
-
Indicators or other analysis techniques created by others require long-term observation to understand and utilize.
Therefore, rather than defining them as right or wrong, consider them as possible and consistently check real-time data to make them your own.
-
Thank you for reading to the end.
I wish you successful trading.
--------------------------------------------------
- This is an explanation of the big picture.
(3-year bull market, 1-year bear market pattern)
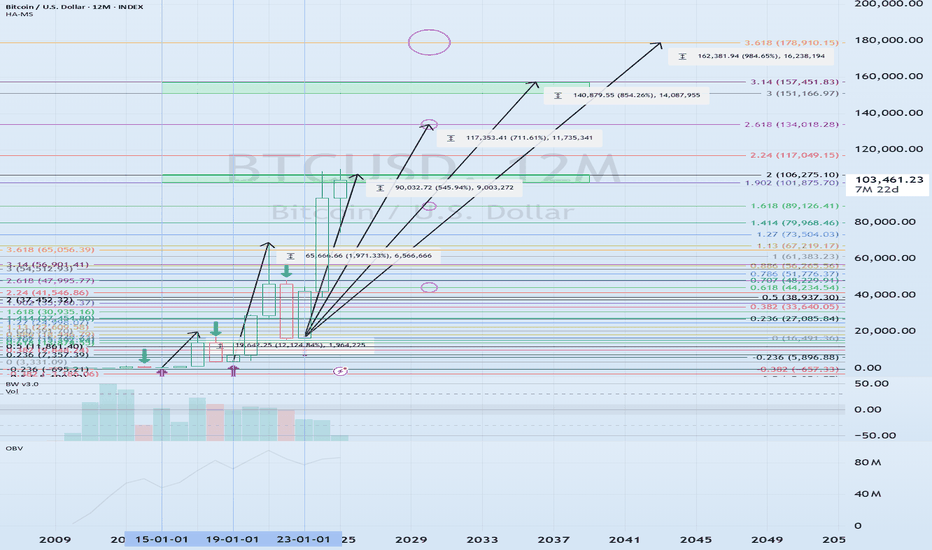
I will explain in more detail when the bear market begins.
------------------------------------------------------
交易开始
#BTCUSDTTo sustain the uptrend, the price must rise above the HA-High ~ DOM (60) range and hold.
Therefore, the key is whether the price can rise above the 115854.56-119177.56 range and hold.
If it fails and falls below 115854.56, it could meet the M-Signal indicator on the 1W chart and re-establish the trend.
At this point, the key point is 108353.0.
In other words, we need to determine whether support can be found around 108353.0 and whether an upward trend can occur.
A decline below 108353.0 is expected to trigger a downtrend.
Therefore, we need to observe how the price moves during the next volatility period, around August 24th (August 23rd-25th).
As I've repeatedly mentioned, it's best to refrain from entering new trades during this volatility period.
This is because the direction of the movement is uncertain.
If the price declines, the HA-High and HA-Low indicators on the 1M, 1W, and 1D charts may re-form.
Therefore, if a new support level is formed, it's important to determine whether there is support near that level.
注释
#BTCUSDTThe TC (Trend Check) indicator is showing a downward trend below zero.
The TC indicator is a comprehensive evaluation of the StochRSI + OBV + PVT-MACD oscillator indicators.
Therefore, if the TC indicator is showing an upward trend below zero,
- it can be interpreted as a bullish trend,
- and a bearish trend can be interpreted as a bearish trend.
In other words, if the price rises above the 0 point, indicating an upward trend, the price is likely to rise.
Since the K indicator on the StochRSI appears to have entered the oversold zone, the decline may be limited.
Therefore, the key question is whether there is support around 115854.56.
注释
#BTCUSDTWith this decline, the M-Signal indicator on the 1W chart is showing signs of forming a new pattern.
Therefore, the key question is whether the price can rise above 116259.91 and hold.
If not, further declines are likely.
After the volatility period around August 24th (August 23rd-25th), we need to see where the price will hold around the 115854.56 level.

YouTube: youtube.com/@readcrypto9837
※ Follow X to check out the posts.
※ X를 팔로우하고 게시물을 확인하세요.
◆ t.me/readCryptoChannel
[HA-MS Indicator]
bit.ly/3YxHgvN
[OBV Indicator]
bit.ly/4dcyny3
※ Follow X to check out the posts.
※ X를 팔로우하고 게시물을 확인하세요.
◆ t.me/readCryptoChannel
[HA-MS Indicator]
bit.ly/3YxHgvN
[OBV Indicator]
bit.ly/4dcyny3
相关出版物
免责声明
这些信息和出版物并非旨在提供,也不构成TradingView提供或认可的任何形式的财务、投资、交易或其他类型的建议或推荐。请阅读使用条款了解更多信息。
YouTube: youtube.com/@readcrypto9837
※ Follow X to check out the posts.
※ X를 팔로우하고 게시물을 확인하세요.
◆ t.me/readCryptoChannel
[HA-MS Indicator]
bit.ly/3YxHgvN
[OBV Indicator]
bit.ly/4dcyny3
※ Follow X to check out the posts.
※ X를 팔로우하고 게시물을 확인하세요.
◆ t.me/readCryptoChannel
[HA-MS Indicator]
bit.ly/3YxHgvN
[OBV Indicator]
bit.ly/4dcyny3
相关出版物
免责声明
这些信息和出版物并非旨在提供,也不构成TradingView提供或认可的任何形式的财务、投资、交易或其他类型的建议或推荐。请阅读使用条款了解更多信息。