
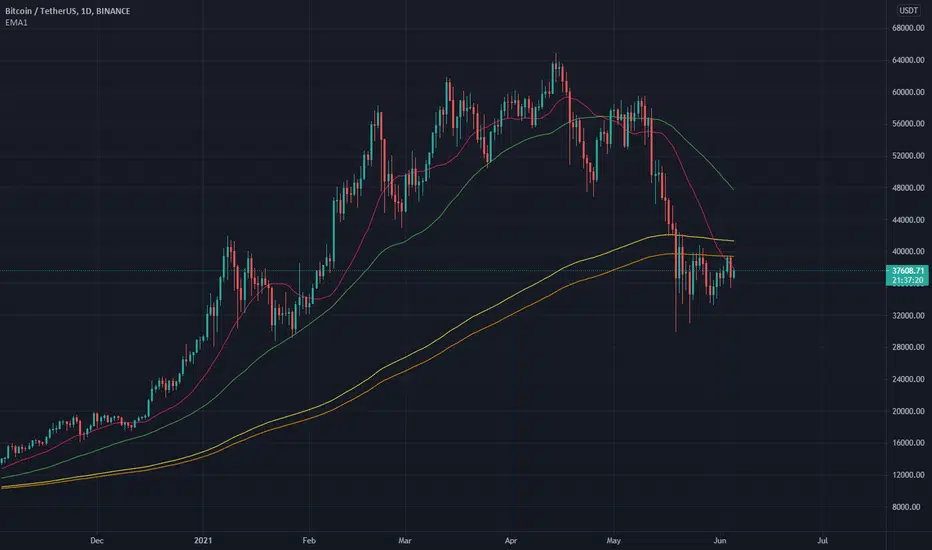
On the 1 day chart, Bitcoin is now below the 200 and the 233 EMA . (yellow and orange)
The 20 SMA (pink) has met the consolidation triangle at the top of the current candle. Usually the price of bitcoin follows the 20 SMA closely if you look at the past price action.
Yesterday we had a bearish engulfing candle.
With the combination of these things, I would expect continuation to the downside today.
The 20 SMA (pink) has met the consolidation triangle at the top of the current candle. Usually the price of bitcoin follows the 20 SMA closely if you look at the past price action.
Yesterday we had a bearish engulfing candle.
With the combination of these things, I would expect continuation to the downside today.
注释
You can also draw trend lines on indicators/oscillators. Looking at this oscillator, it looks like we have reached the top of the trend and would be ready for a move back down soon 注释
注释
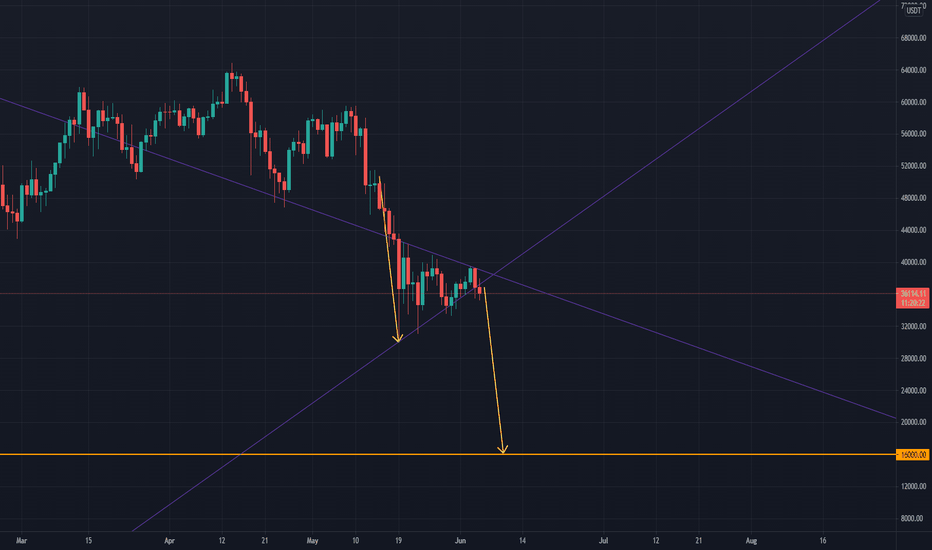
Looks like we fell out of the triangle on the 3 day chart 注释
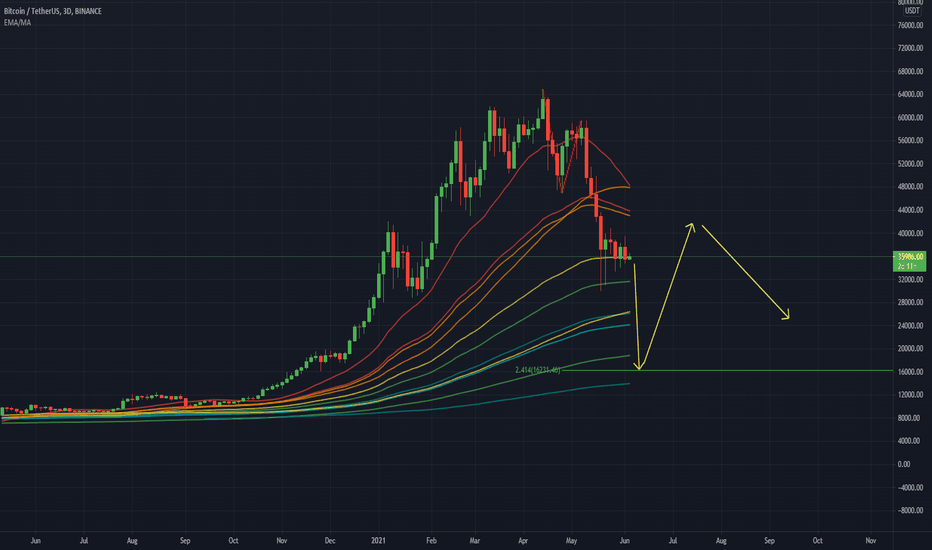
Looks like plenty of downside ahead on the Volume Supported Linear Regression 注释

免责声明
这些信息和出版物并非旨在提供,也不构成TradingView提供或认可的任何形式的财务、投资、交易或其他类型的建议或推荐。请阅读使用条款了解更多信息。
免责声明
这些信息和出版物并非旨在提供,也不构成TradingView提供或认可的任何形式的财务、投资、交易或其他类型的建议或推荐。请阅读使用条款了解更多信息。