
Hello everyone,
Let's take a look at the BTC to USDT 1 day chart.
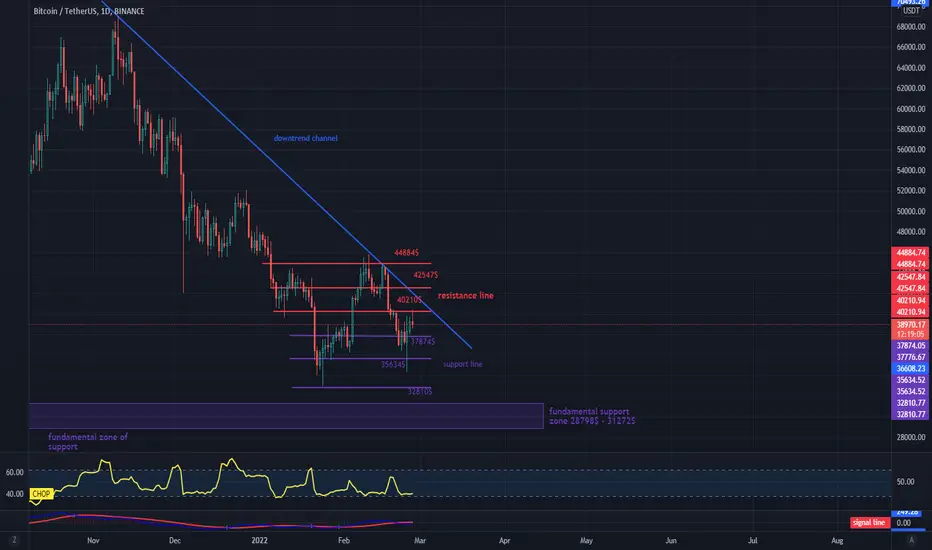
Let's start by identifying the downtrend line on which the price is currently moving.
Currently, the price is just above the first support at $ 37,874 if we don't defend this level, the next support is $ 35,634 and $ 32,810, the next support is in a fundamental support zone between $ 31,272 and $ 28,798.
The first resistance can be found at $ 40,210, the price of which has already touched and retreated slightly, and the next at $ 42,547 and $ 44,884.
The CHOP indicator shows a lack of energy in the 1-day interval.
Let's take a look at the BTC to USDT 1 day chart.
Let's start by identifying the downtrend line on which the price is currently moving.
Currently, the price is just above the first support at $ 37,874 if we don't defend this level, the next support is $ 35,634 and $ 32,810, the next support is in a fundamental support zone between $ 31,272 and $ 28,798.
The first resistance can be found at $ 40,210, the price of which has already touched and retreated slightly, and the next at $ 42,547 and $ 44,884.
The CHOP indicator shows a lack of energy in the 1-day interval.

免责声明
这些信息和出版物并非旨在提供,也不构成TradingView提供或认可的任何形式的财务、投资、交易或其他类型的建议或推荐。请阅读使用条款了解更多信息。
免责声明
这些信息和出版物并非旨在提供,也不构成TradingView提供或认可的任何形式的财务、投资、交易或其他类型的建议或推荐。请阅读使用条款了解更多信息。