
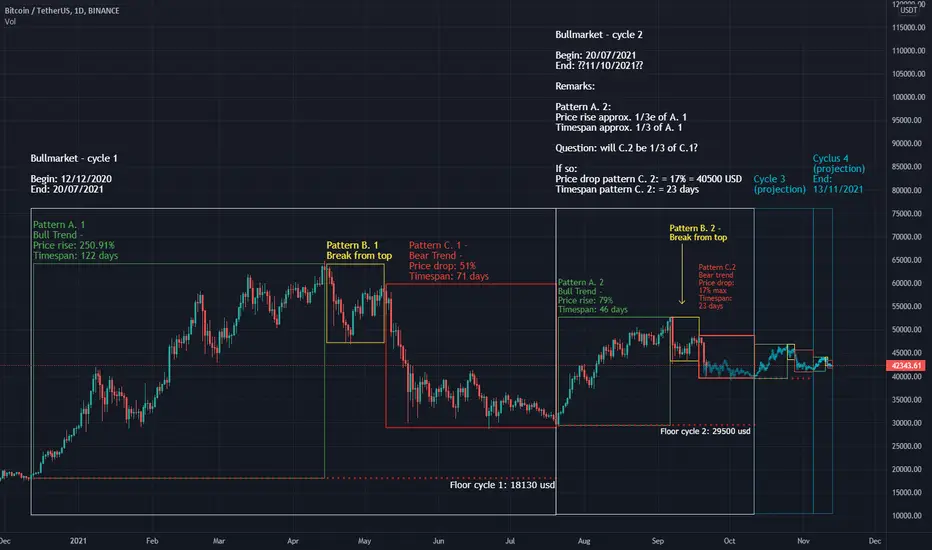
This analysis highlights the patterns that repeat on the daily BTC-USDT chart, and projects what were to happen if these patterns were to keep repeating.
It shows the emergence of a symmetrical wedge.
This leads to a second chart, illustrating the symmetrical wedge poised for breakout second half of November to a top of 90.000 USD / BTC. It is linked as a related idea.
It shows the emergence of a symmetrical wedge.
This leads to a second chart, illustrating the symmetrical wedge poised for breakout second half of November to a top of 90.000 USD / BTC. It is linked as a related idea.

免责声明
这些信息和出版物并非旨在提供,也不构成TradingView提供或认可的任何形式的财务、投资、交易或其他类型的建议或推荐。请阅读使用条款了解更多信息。