
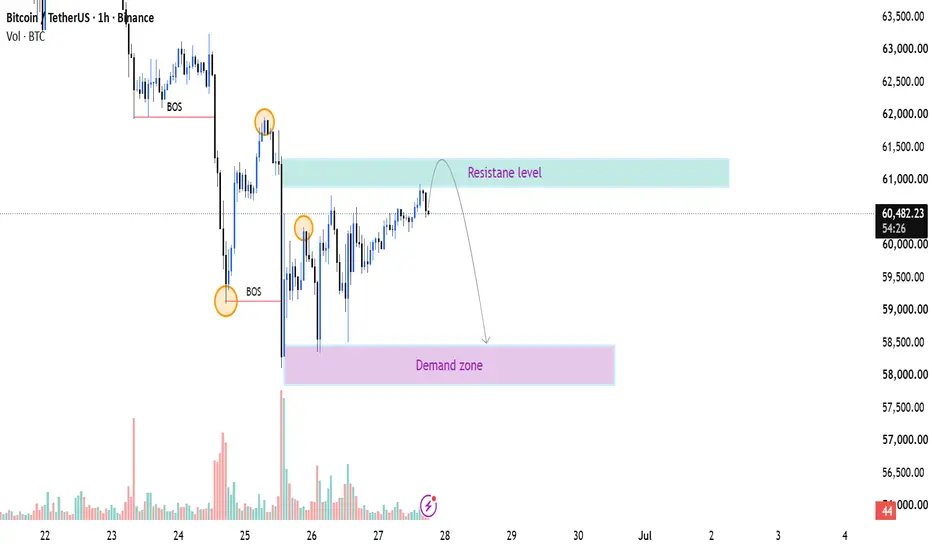
BTCUSDT is currently trading inside a corrective recovery after a strong bearish impulse that broke previous market structure (BOS). The recent bounce has been fueled by short-term buying pressure, but price is now approaching a significant 1H resistance/supply zone around 60.9K–61.3K, where sellers are likely to step back into the market.
The highlighted resistance aligns with the origin of the previous sell-off, making it a high-probability area for bearish reactions. Unless buyers can produce a strong breakout and close above this zone, the current move appears to be a retracement rather than the beginning of a new bullish trend.
The recent sequence of higher lows shows buyers attempting to regain control, but momentum is slowing as price enters resistance. A rejection here could confirm that the broader bearish structure remains intact.
Trading Scenario
Resistance Zone: 60,900 – 61,300
Wait for bearish confirmation such as:
Bearish engulfing candle
Rejection wick
Lower high formation
Break of minor bullish structure
A confirmed rejection could open the path toward the 58,000–58,500 demand zone, which is the next major liquidity area shown on the chart.
Bullish Invalidation
If BTC closes decisively above the resistance zone with strong volume, the bearish setup would be invalidated and buyers could target higher liquidity levels.
Key Levels
🔴 Resistance: 60.9K – 61.3K
🟣 Demand: 58.0K – 58.5K
📉 Bias: Bearish below resistance
The highlighted resistance aligns with the origin of the previous sell-off, making it a high-probability area for bearish reactions. Unless buyers can produce a strong breakout and close above this zone, the current move appears to be a retracement rather than the beginning of a new bullish trend.
The recent sequence of higher lows shows buyers attempting to regain control, but momentum is slowing as price enters resistance. A rejection here could confirm that the broader bearish structure remains intact.
Trading Scenario
Resistance Zone: 60,900 – 61,300
Wait for bearish confirmation such as:
Bearish engulfing candle
Rejection wick
Lower high formation
Break of minor bullish structure
A confirmed rejection could open the path toward the 58,000–58,500 demand zone, which is the next major liquidity area shown on the chart.
Bullish Invalidation
If BTC closes decisively above the resistance zone with strong volume, the bearish setup would be invalidated and buyers could target higher liquidity levels.
Key Levels
🔴 Resistance: 60.9K – 61.3K
🟣 Demand: 58.0K – 58.5K
📉 Bias: Bearish below resistance

free join my telegram channel
forex channel :t.me/GoldMarket_Vision9
daily 5-7 high accuracy signals
Crypto Channel :t.me/Crypto_Institute9
forex channel :t.me/GoldMarket_Vision9
daily 5-7 high accuracy signals
Crypto Channel :t.me/Crypto_Institute9
相关出版物
免责声明
这些信息和出版物并非旨在提供,也不构成TradingView提供或认可的任何形式的财务、投资、交易或其他类型的建议或推荐。请阅读使用条款了解更多信息。
free join my telegram channel
forex channel :t.me/GoldMarket_Vision9
daily 5-7 high accuracy signals
Crypto Channel :t.me/Crypto_Institute9
forex channel :t.me/GoldMarket_Vision9
daily 5-7 high accuracy signals
Crypto Channel :t.me/Crypto_Institute9
相关出版物
免责声明
这些信息和出版物并非旨在提供,也不构成TradingView提供或认可的任何形式的财务、投资、交易或其他类型的建议或推荐。请阅读使用条款了解更多信息。