
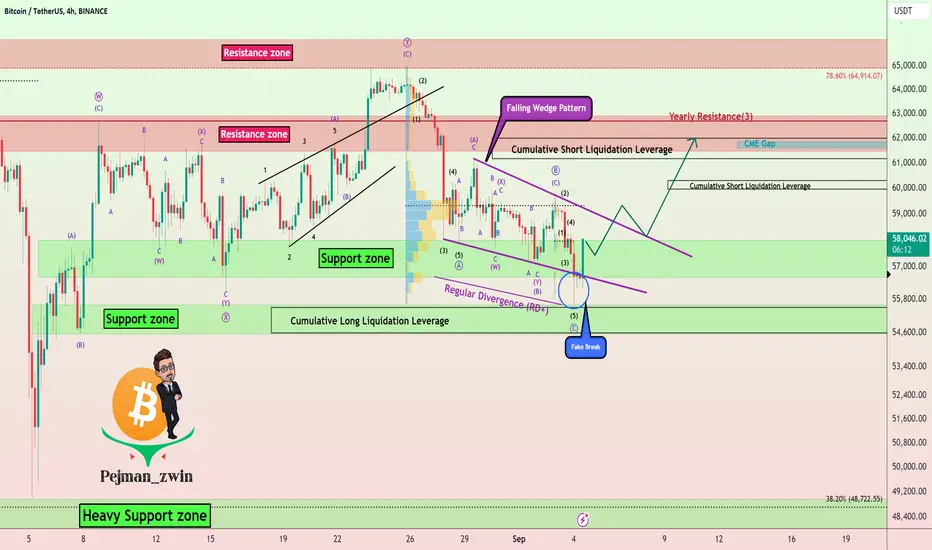
Bitcoin started to rise again after Failing(Fake Break) to break the Support zone($58,000-$56,600).
From the point of view of Classical Technical Analysis, it seems that Bitcoin has formed a Falling Wedge Reversal Pattern, and if the upper line of this pattern breaks, we can expect a further increase in Bitcoin.
From the point of view of Elliott wave theory, Bitcoin's correction waves seem to be continuing. The last corrective wave was the Zigzag Correction(ABC/5-3-5), which was the end of wave C, $55,600.
Also, we can see Regular Divergence(RD+) between Consecutive Valleys.
A head and shoulders pattern could form, causing Bitcoin to decline again to nearly $50,000==Two scenarios are possible👇

I expect Bitcoin to move according to the movements I have outlined in the chart.
Note: If Bitcoin loses the Support zone($58,000-$56,600), we should expect Bitcoin to fall to $51,000(at least).
Bitcoin Analyze (BTCUSDT), 4-hour time frame⏰.
Do not forget to put Stop loss for your positions (For every position you want to open).
Please follow your strategy and updates; this is just my Idea, and I will gladly see your ideas in this post.
Please do not forget the ✅' like'✅ button 🙏😊 & Share it with your friends; thanks, and Trade safe.
From the point of view of Classical Technical Analysis, it seems that Bitcoin has formed a Falling Wedge Reversal Pattern, and if the upper line of this pattern breaks, we can expect a further increase in Bitcoin.
From the point of view of Elliott wave theory, Bitcoin's correction waves seem to be continuing. The last corrective wave was the Zigzag Correction(ABC/5-3-5), which was the end of wave C, $55,600.
Also, we can see Regular Divergence(RD+) between Consecutive Valleys.
A head and shoulders pattern could form, causing Bitcoin to decline again to nearly $50,000==Two scenarios are possible👇
I expect Bitcoin to move according to the movements I have outlined in the chart.
Note: If Bitcoin loses the Support zone($58,000-$56,600), we should expect Bitcoin to fall to $51,000(at least).
Bitcoin Analyze (BTCUSDT), 4-hour time frame⏰.
Do not forget to put Stop loss for your positions (For every position you want to open).
Please follow your strategy and updates; this is just my Idea, and I will gladly see your ideas in this post.
Please do not forget the ✅' like'✅ button 🙏😊 & Share it with your friends; thanks, and Trade safe.
订单已取消
As I mentioned, " if the upper line of this pattern breaks, we can expect a further increase in Bitcoin.&If Bitcoin loses the Support zone($58,000-$56,600), we should expect Bitcoin to fall to $51,000(at least).
You can search for a Short position.

🚀 Up to 75% Trading Fee Rebates Across 20+ Exchanges:
🤖 t.me/Protrader365bot
-----
🎁 Free VIP Forex and Crypto Signals, please visit:
🔗 t.me/ProTrader_365
🤖 t.me/Protrader365bot
-----
🎁 Free VIP Forex and Crypto Signals, please visit:
🔗 t.me/ProTrader_365
相关出版物
免责声明
这些信息和出版物并非旨在提供,也不构成TradingView提供或认可的任何形式的财务、投资、交易或其他类型的建议或推荐。请阅读使用条款了解更多信息。
🚀 Up to 75% Trading Fee Rebates Across 20+ Exchanges:
🤖 t.me/Protrader365bot
-----
🎁 Free VIP Forex and Crypto Signals, please visit:
🔗 t.me/ProTrader_365
🤖 t.me/Protrader365bot
-----
🎁 Free VIP Forex and Crypto Signals, please visit:
🔗 t.me/ProTrader_365
相关出版物
免责声明
这些信息和出版物并非旨在提供,也不构成TradingView提供或认可的任何形式的财务、投资、交易或其他类型的建议或推荐。请阅读使用条款了解更多信息。