
Is Bitcoin's "bottom" reached?
Bitcoin Descending Triangle Analysis 🔥
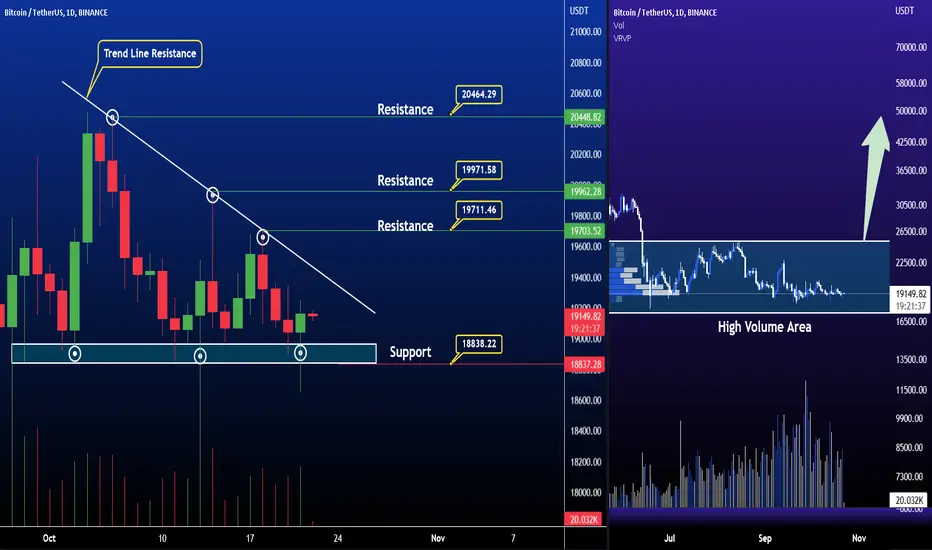
The above chart of Bitcoin ( BTCUSDT ) laid out the descending triangle pattern. This pattern is often regarded as a characteristic of a bearish trend . It is formed by the upper trend line that connects the highs and a horizontal trend line connecting lows converges to form a triangle. If the price action breaches the lower support level , the bearish trend would be sustained.
Currently, Bitcoin ( BTCUSDT ) is in the range of $ 19150. If the pattern continues, the price of Bitcoin ( BTCUSDT ) might reach the support levels of $20000, If the trend reverses, then the price of Bitcoin ( BTCUSDT ) may rise to $18800
Volume Profile View - Good volume has been added at the bottom level
Hope for recovery
Happy Trading
Bitcoin Descending Triangle Analysis 🔥
The above chart of Bitcoin ( BTCUSDT ) laid out the descending triangle pattern. This pattern is often regarded as a characteristic of a bearish trend . It is formed by the upper trend line that connects the highs and a horizontal trend line connecting lows converges to form a triangle. If the price action breaches the lower support level , the bearish trend would be sustained.
Currently, Bitcoin ( BTCUSDT ) is in the range of $ 19150. If the pattern continues, the price of Bitcoin ( BTCUSDT ) might reach the support levels of $20000, If the trend reverses, then the price of Bitcoin ( BTCUSDT ) may rise to $18800
Volume Profile View - Good volume has been added at the bottom level
Hope for recovery
Happy Trading

免责声明
这些信息和出版物并非旨在提供,也不构成TradingView提供或认可的任何形式的财务、投资、交易或其他类型的建议或推荐。请阅读使用条款了解更多信息。