
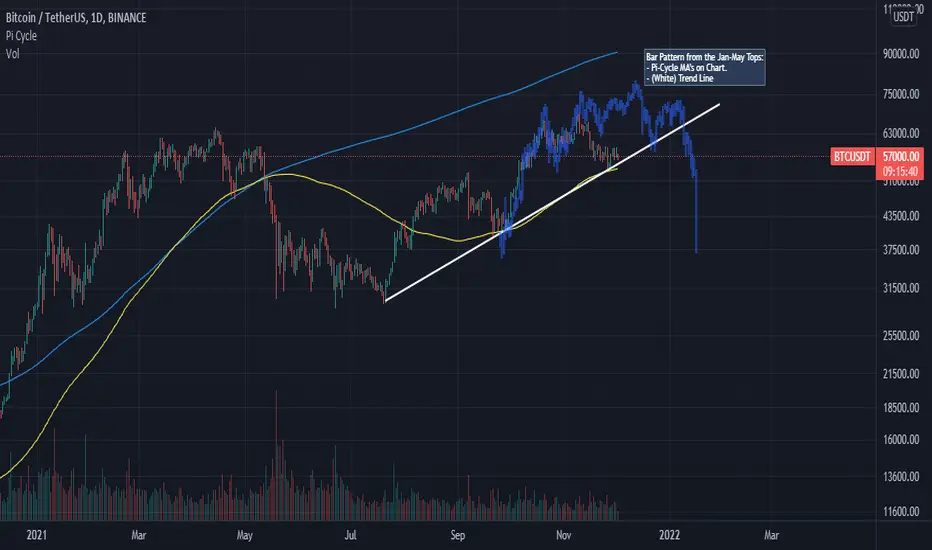
A bar pattern of the Jan-May higher high's has been taken and over-layed the current structure. The DMA's are the Pi-Cycle top model (top is a moving avg of 350*2, bottom is a 111 day MA) have served as critical lines of resistance and support.
What am I watching?
- First, the bar pattern is clearly similar, however, less explosive. (Less buying power and investor impetus).
- In order to stage a leg to the downside, we must complete the LH from a top and break the 111DMA.
- Trend Line has to be broken.
- Lastly, strong sell volume can be appreciated during a top, followed by weak buying volume the following top.
Just my .02
Cheers

免责声明
这些信息和出版物并非旨在提供,也不构成TradingView提供或认可的任何形式的财务、投资、交易或其他类型的建议或推荐。请阅读使用条款了解更多信息。