Hello traders! Here is my latest technical outlook for Bitcoin (BTCUSDT) on the 4-hour timeframe.
### 📊 Market Overview
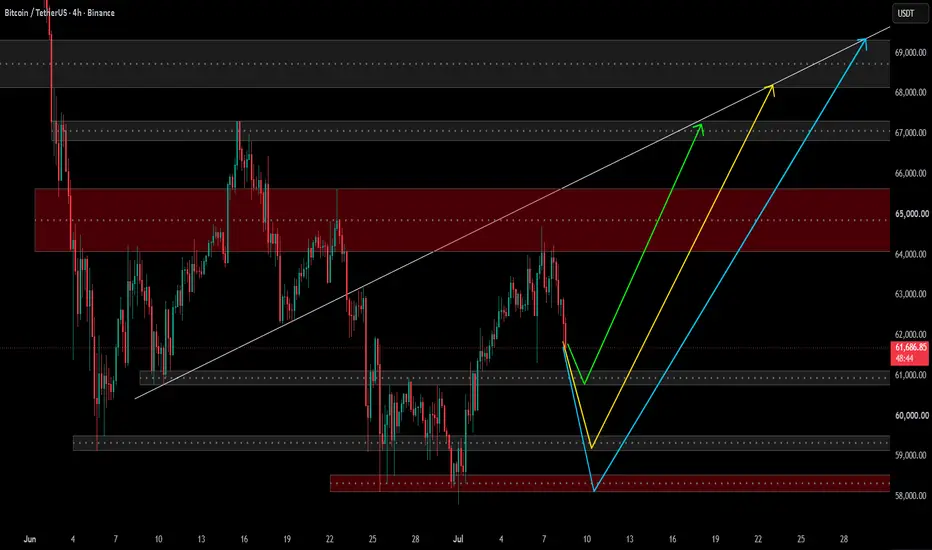
Bitcoin is currently consolidating around the *$61,800 area after breaking below the ascending trendline. Looking closely at the current market structure, I have mapped out three potential trajectories based on key liquidity and support zones.
---
### 🟢 My Primary Scenario: The Green Path (Highly Likely)
I am personally favoring the Green Path for the upcoming move. Here is the breakdown:
*Shallow Liquidity Grab: I expect a brief dip into the immediate support zone between $60,500 and $61,000 to trap late shorts and build buy volume.
*Bullish Reversal: Once buyers defend this area, we should see a strong upward momentum capable of breaking through the major red resistance zone ($64,000 – $65,500).
*Target: My main target for this specific wave is around the $67,000 level.
---
### 🟡 & 🔵 Alternative Scenarios (Yellow & Blue Paths)
If the immediate support fails to hold, we must be prepared for a deeper correction before the next major leg up:
*Yellow Path: A deeper dip down to the $59,000 support level to clear liquidity before a sharp bounce towards $68,000.
*Blue Path: A worst-case short-term scenario testing the major demand zone cluster at $57,500 – $58,000 before a massive rally back to $69,000.
---
### 🔑 Key Levels to Watch
*Immediate Support Zone: $60,500 - $61,000
*Major Demand Zone: $57,500 - $59,000
*Key Resistance Block: $64,000 - $65,500
What are your thoughts on this setup? Do you think the immediate support will hold for the green path, or are we heading deeper first? Let me know in the comments below!
⚠️ Disclaimer: This analysis is for educational purposes only and represents my personal opinion. It is not financial advice. Always manage your risk properly.*
### 📊 Market Overview
Bitcoin is currently consolidating around the *$61,800 area after breaking below the ascending trendline. Looking closely at the current market structure, I have mapped out three potential trajectories based on key liquidity and support zones.
---
### 🟢 My Primary Scenario: The Green Path (Highly Likely)
I am personally favoring the Green Path for the upcoming move. Here is the breakdown:
*Shallow Liquidity Grab: I expect a brief dip into the immediate support zone between $60,500 and $61,000 to trap late shorts and build buy volume.
*Bullish Reversal: Once buyers defend this area, we should see a strong upward momentum capable of breaking through the major red resistance zone ($64,000 – $65,500).
*Target: My main target for this specific wave is around the $67,000 level.
---
### 🟡 & 🔵 Alternative Scenarios (Yellow & Blue Paths)
If the immediate support fails to hold, we must be prepared for a deeper correction before the next major leg up:
*Yellow Path: A deeper dip down to the $59,000 support level to clear liquidity before a sharp bounce towards $68,000.
*Blue Path: A worst-case short-term scenario testing the major demand zone cluster at $57,500 – $58,000 before a massive rally back to $69,000.
---
### 🔑 Key Levels to Watch
*Immediate Support Zone: $60,500 - $61,000
*Major Demand Zone: $57,500 - $59,000
*Key Resistance Block: $64,000 - $65,500
What are your thoughts on this setup? Do you think the immediate support will hold for the green path, or are we heading deeper first? Let me know in the comments below!
⚠️ Disclaimer: This analysis is for educational purposes only and represents my personal opinion. It is not financial advice. Always manage your risk properly.*
注释

 BTCUSDT BTCUSD i haven't seen such an indecision hours in market , Iran war , Hurmuz conflicts , trump's tweets and news around these included semi hawkish and semi dovish fomc minute and a bunch of uncertain orders which trapped between heavy resistance and support , oh my god what a night we are facing ! but anything happens i want to send my greetings to all free and bright souls of humanity around the globe from IRAN , my beautiful and strong home land .
交易开始
there's no new low i opened long 注释
BTCUSDT bts is showing a new behaviour , not caring about geopolitics any more it wont give any shets to any news again , road is clear to ATH at 4th 2026 quarter don't miss it it's clearly attacking 66800 and i believe it will break it trough 67800-69300-71700-72600-74300 , july will cover all june's downtrend like a bullish engulf , this will send our beloved btc to the moon soon ;) ( soon means at least a year or 18 months )注释
BTCUSDT BTCUSD hello everyone , as you saw the market makers and whales shaked out buyers at 15:35 (utc) 5min candle and made sellers enter with a big red bloody candle but as you are watching the market , soon new sellers will get eliminated and their SLs will hit. There will be almost no retail traders left .注释
i'm still bullish on BTC注释
BTCUSDT BTCUSD Please check the 4H chart from 6 to 15 June. Something like this is forming, but the difference is that in those 2 leg movements, the 1st one was something 1.5x of the current move, and you know what I believe the current rally's 2nd leg will be 1.5x of 6-15 June's 2nd upward leg, I wish you understand what I mean, according to this theory my next target is 70K 
相关出版物
免责声明
这些信息和出版物并非旨在提供,也不构成TradingView提供或认可的任何形式的财务、投资、交易或其他类型的建议或推荐。请阅读使用条款了解更多信息。