
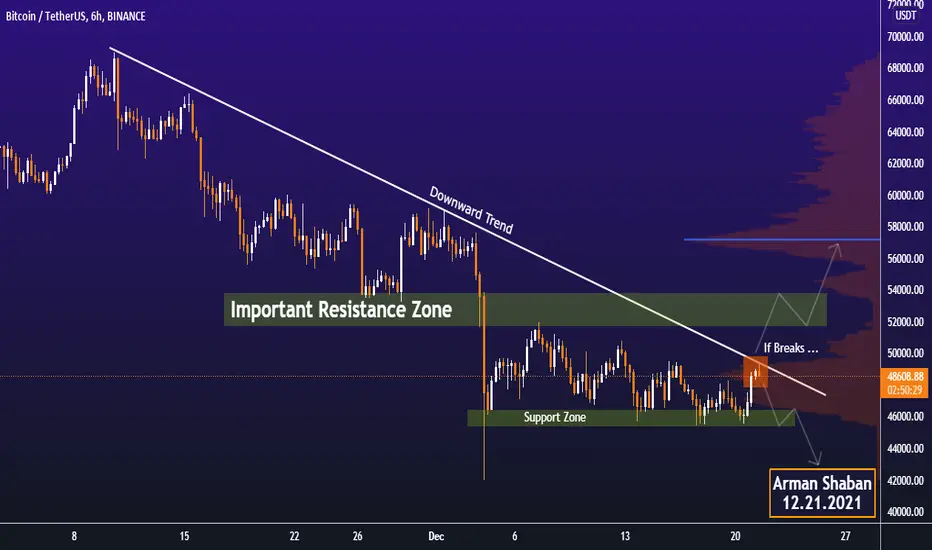
Examining the Bitcoin chart in 6-hour timeframe, we see that the price has reached the ceiling of dynamic resistance and its volumetric resistance, and if this resistance is broken and the price stabilized above it, the targets will be $ 51600, $ 53000 and $ 57000, respectively. (This is an optimistic analysis of bitcoin, and if it comes true, its next targets has shown on the weekly chart)
Daily Analysis :
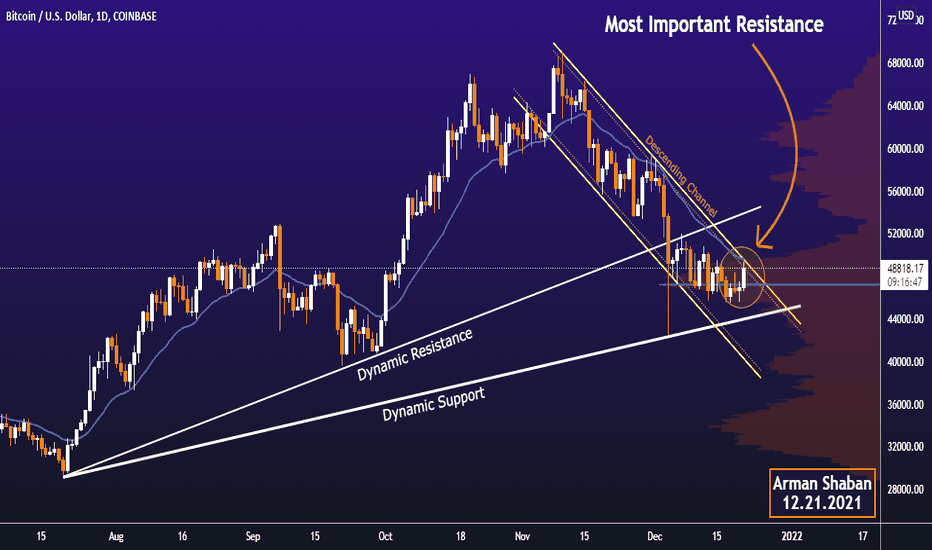
Weekly Analysis :

Follow our other analysis & Feel free to ask any questions you have, we are here to help.
⚠️ This Analysis will be updated ...
👤 Arman Shaban : ArmanShabanTrading
📅 21.DEC.2021
⚠️(DYOR)
❤️ If you apperciate my work , Please like and comment , It Keeps me motivated to do better ❤️
Daily Analysis :
Weekly Analysis :
Follow our other analysis & Feel free to ask any questions you have, we are here to help.
⚠️ This Analysis will be updated ...
👤 Arman Shaban : ArmanShabanTrading
📅 21.DEC.2021
⚠️(DYOR)
❤️ If you apperciate my work , Please like and comment , It Keeps me motivated to do better ❤️

📘 Wanna Learn ICT & SMC? Get the Full Book Here : bit.ly/ICT-BOOK
⚜️ Free Telegram Channel : t.me/PriceAction_ICT
⚜️ JOIN THE VIP 👉 t.me/ArmanShabanTrading
🤝 Up to 660 USDT as Rewards : bit.ly/WEEX-Promo
⚜️ Free Telegram Channel : t.me/PriceAction_ICT
⚜️ JOIN THE VIP 👉 t.me/ArmanShabanTrading
🤝 Up to 660 USDT as Rewards : bit.ly/WEEX-Promo
相关出版物
免责声明
这些信息和出版物并非旨在提供,也不构成TradingView提供或认可的任何形式的财务、投资、交易或其他类型的建议或推荐。请阅读使用条款了解更多信息。