
For context please review this idea:
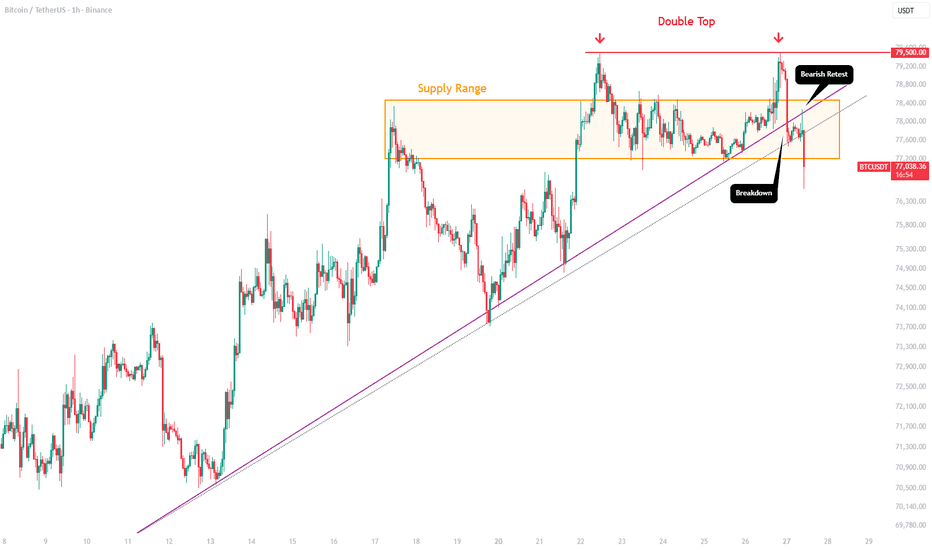
Once BTC broke its lower timeframe (1H) structure, specifically the purple and dotted black trendlines, price fell from above $77,000 down to its pivot low at $74,900.
Now price is reacting in a very significant way to those same trendlines outlined in the previous post. Since those trendlines were support, once price broke below them they flipped into resistance and now those levels seem top be acting as an offloading zone rather than a level to accumulate.
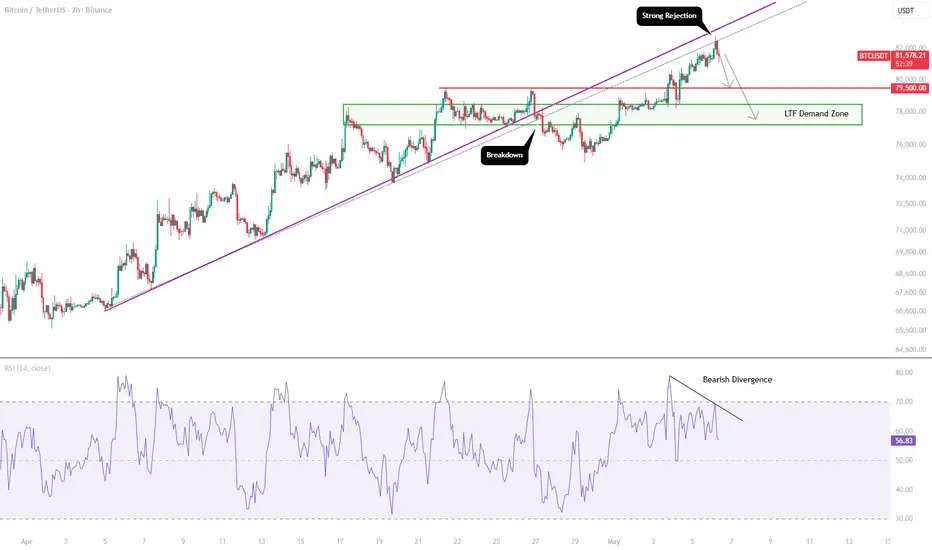
On the current 2H chart, price rallied all the way back up to the dotted black trendline and closed the 2H candle right at it before seeing a strong rejection. This is a textbook bearish retest similar to what I outlined in my previous idea.
In addition to that, a bearish divergence is forming on the 2H RSI. Price formed a higher high while the RSI formed a lower high and has since rejected right from the 70 level.
This could be the beginning of the larger downside move, but it is far too early to tell based on the lower timeframe alone. For now, watch for a move toward the $79,500 level as a potential support zone, or even the old supply zone that may now be acting as a lower timeframe demand zone (green box) if selling pressure continues.
Once BTC broke its lower timeframe (1H) structure, specifically the purple and dotted black trendlines, price fell from above $77,000 down to its pivot low at $74,900.
Now price is reacting in a very significant way to those same trendlines outlined in the previous post. Since those trendlines were support, once price broke below them they flipped into resistance and now those levels seem top be acting as an offloading zone rather than a level to accumulate.
On the current 2H chart, price rallied all the way back up to the dotted black trendline and closed the 2H candle right at it before seeing a strong rejection. This is a textbook bearish retest similar to what I outlined in my previous idea.
In addition to that, a bearish divergence is forming on the 2H RSI. Price formed a higher high while the RSI formed a lower high and has since rejected right from the 70 level.
This could be the beginning of the larger downside move, but it is far too early to tell based on the lower timeframe alone. For now, watch for a move toward the $79,500 level as a potential support zone, or even the old supply zone that may now be acting as a lower timeframe demand zone (green box) if selling pressure continues.

免责声明
这些信息和出版物并非旨在提供,也不构成TradingView提供或认可的任何形式的财务、投资、交易或其他类型的建议或推荐。请阅读使用条款了解更多信息。