
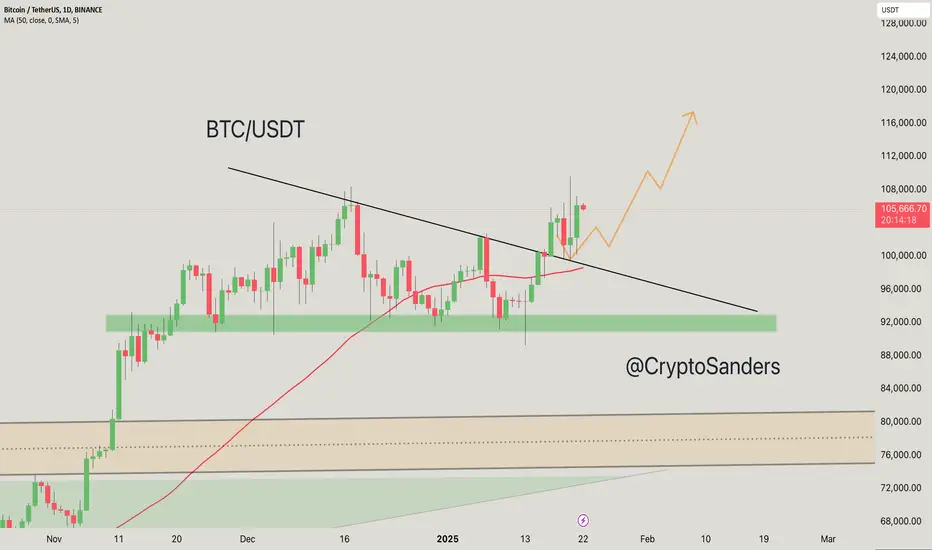
BTC has sustained its move above the descending trendline, indicating a valid breakout with continued bullish momentum.
The green zone between $92,000–$96,000 remains a critical support area. Any pullbacks into this region could present buying opportunities.
The 50-day SMA (red) at $98,596 is trending upwards, providing additional dynamic support.
BTC is trading above key moving averages, reinforcing the positive trend.
The chart suggests a potential pullback followed by a continuation to the upside.
The projected path (orange line) targets the $112,000–$116,000 resistance zone.
Assess volume during pullbacks to ensure strong accumulation support for the upward trend.
If you found this analysis helpful, hit the Like button and share your thoughts or questions in the comments below. Your feedback matters!
Thanks for your support!
DYOR. NFA
The green zone between $92,000–$96,000 remains a critical support area. Any pullbacks into this region could present buying opportunities.
The 50-day SMA (red) at $98,596 is trending upwards, providing additional dynamic support.
BTC is trading above key moving averages, reinforcing the positive trend.
The chart suggests a potential pullback followed by a continuation to the upside.
The projected path (orange line) targets the $112,000–$116,000 resistance zone.
Assess volume during pullbacks to ensure strong accumulation support for the upward trend.
If you found this analysis helpful, hit the Like button and share your thoughts or questions in the comments below. Your feedback matters!
Thanks for your support!
DYOR. NFA

相关出版物
免责声明
这些信息和出版物并非旨在提供,也不构成TradingView提供或认可的任何形式的财务、投资、交易或其他类型的建议或推荐。请阅读使用条款了解更多信息。