
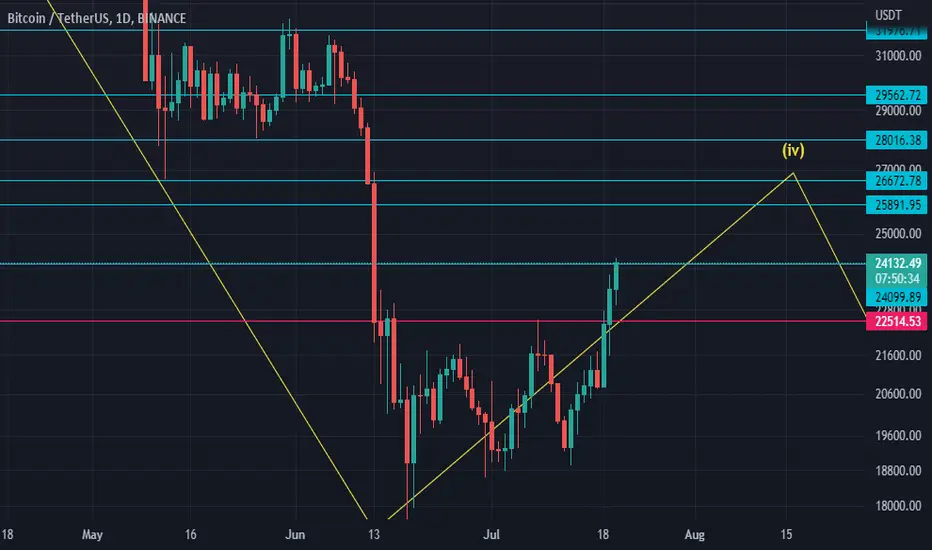
This is how I see BTC short-med-long term
as you see in the chart above I think BTC is in its 4th wave
mostly reverse around 0.38 fibo =~25700
I put other levels the price could reach
in this chart down, you can see the whole wave + the parallel channel

*
*
In this one, you can see the double-top and his target, reclaiming the nick-line is strongly bullish

*
*
there you can see USDT dominance targets and the potential reverse up to 10%

*
*
also, DXY is still bullish, as I mentioned before his targeting 112

*
conclusion, short-term bullish /mid-term bearish /long-term bullish
that could change if I saw a good move in the chart or if the price reclaimed important resistance like 28600 and 32000
I have other reasons to be bearish ( economic conditions )
boost this idea if you like it
as you see in the chart above I think BTC is in its 4th wave
mostly reverse around 0.38 fibo =~25700
I put other levels the price could reach
in this chart down, you can see the whole wave + the parallel channel
*
*
In this one, you can see the double-top and his target, reclaiming the nick-line is strongly bullish
*
*
there you can see USDT dominance targets and the potential reverse up to 10%
*
*
also, DXY is still bullish, as I mentioned before his targeting 112
*
conclusion, short-term bullish /mid-term bearish /long-term bullish
that could change if I saw a good move in the chart or if the price reclaimed important resistance like 28600 and 32000
I have other reasons to be bearish ( economic conditions )
boost this idea if you like it

免责声明
这些信息和出版物并非旨在提供,也不构成TradingView提供或认可的任何形式的财务、投资、交易或其他类型的建议或推荐。请阅读使用条款了解更多信息。