
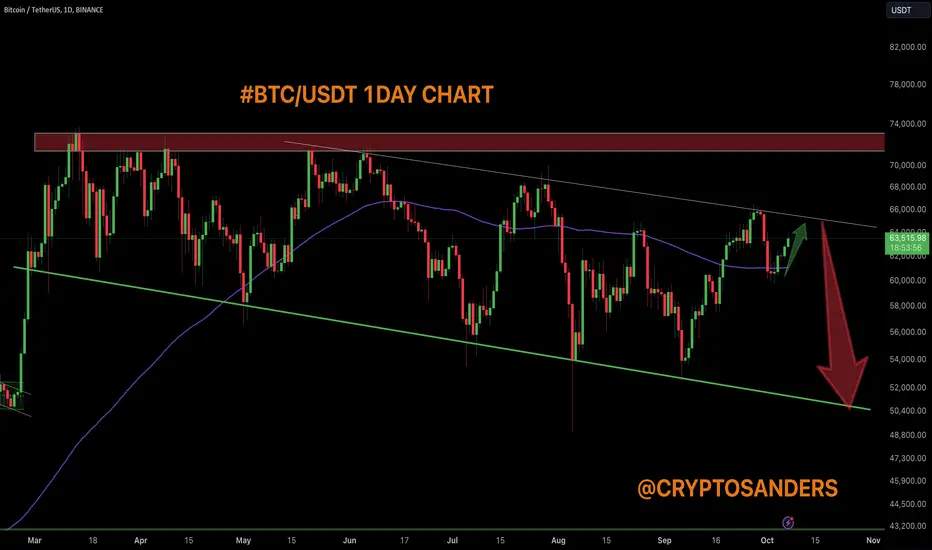
Bitcoin is approaching a crucial resistance area (highlighted in red), which has historically acted as a strong barrier to upward price movement.
The chart suggests a potential bullish scenario where BTC could break the descending trendline and head toward the resistance area. If it successfully breaks this level, it could continue the uptrend.
An alternative scenario is highlighted on the chart with a red arrow, indicating the possibility of a bearish rejection from the resistance area. If Bitcoin fails to break this level, it could face a pullback towards lower support levels.
The lower green trendline represents a key support area. If the rejection occurs, BTC could retrace towards this trendline, which is around the $50,000-$52,000 range, which offers strong support. The chart shows two possible outcomes: A breakout above the resistance zone could lead to further gains. Failure to break the resistance could result in a downward move towards lower support levels. This dual approach highlights how BTC performs near the resistance zone in determining the next direction of the trend.
Disclaimer: This analysis is for informational purposes and is not financial advice. Always stay updated with market movements and adjust your trading strategies as needed.
You can DM us for information on any other altcoin.
@Peter_CSAdmin
The chart suggests a potential bullish scenario where BTC could break the descending trendline and head toward the resistance area. If it successfully breaks this level, it could continue the uptrend.
An alternative scenario is highlighted on the chart with a red arrow, indicating the possibility of a bearish rejection from the resistance area. If Bitcoin fails to break this level, it could face a pullback towards lower support levels.
The lower green trendline represents a key support area. If the rejection occurs, BTC could retrace towards this trendline, which is around the $50,000-$52,000 range, which offers strong support. The chart shows two possible outcomes: A breakout above the resistance zone could lead to further gains. Failure to break the resistance could result in a downward move towards lower support levels. This dual approach highlights how BTC performs near the resistance zone in determining the next direction of the trend.
Disclaimer: This analysis is for informational purposes and is not financial advice. Always stay updated with market movements and adjust your trading strategies as needed.
You can DM us for information on any other altcoin.
@Peter_CSAdmin

相关出版物
免责声明
这些信息和出版物并非旨在提供,也不构成TradingView提供或认可的任何形式的财务、投资、交易或其他类型的建议或推荐。请阅读使用条款了解更多信息。