
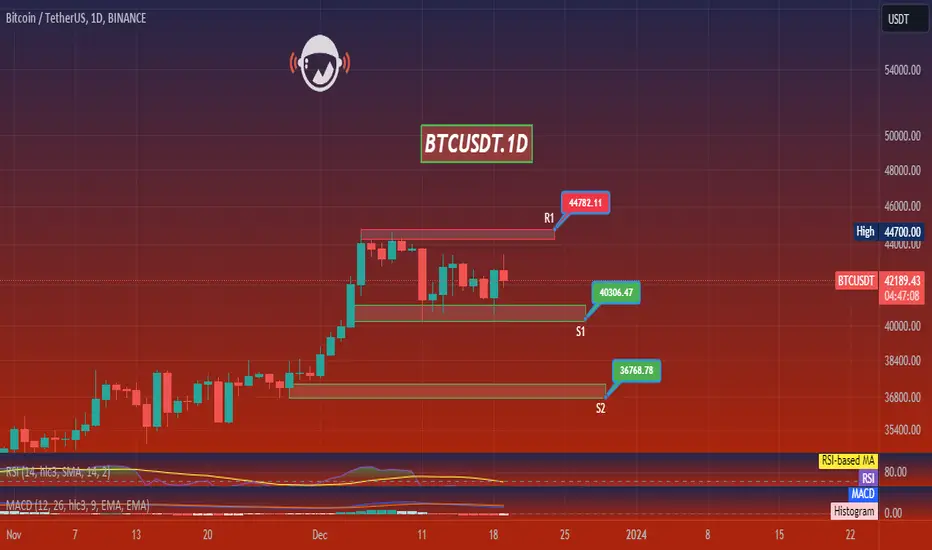
Based on the provided market data, the current price of Bitcoin (BTC) against USDT is $42,199. On the 4-hour chart, the Relative Strength Index (RSI) is at 50.49, indicating a balanced market. The Moving Average Convergence Divergence (MACD) is at 103.03, suggesting a bullish trend. The Bollinger Bands (Bb4h) are at $43,386, indicating a potential resistance level. The support levels on the 4-hour chart are $41,990, $40,946, and $40.198, with the resistance levels at $43,349, $44,268, and $44,800.
On the daily chart, the RSI is at 62.61, indicating a slightly bullish market. The MACD is at 1166.03, suggesting a strong bullish trend. The Bollinger Bands are at $45,625, indicating a potential resistance level. The support levels on the daily chart are $41,954, $38,500, and $35,600, with the resistance levels at $45,521, $46,700, and $49,300.
On the 7-day chart, the RSI is at 80.03, indicating an overbought market and potential for a price correction. The MACD is at 3884.03, suggesting a strong bullish trend. The Bollinger Bands are at $44,900, indicating a potential resistance level. The support levels on the 7-day chart are $32,500, $24,900, and $19,600, with the resistance levels at $48,800, $52,900, and $60,000.
In conclusion, the market data suggests a strong bullish trend for Bitcoin in the short term. However, the high RSI on the 7-day chart indicates that the market is overbought, which might lead to a price correction in the near future. As always, it's important to consider other factors and use proper risk management strategies when trading.

免责声明
这些信息和出版物并非旨在提供,也不构成TradingView提供或认可的任何形式的财务、投资、交易或其他类型的建议或推荐。请阅读使用条款了解更多信息。
免责声明
这些信息和出版物并非旨在提供,也不构成TradingView提供或认可的任何形式的财务、投资、交易或其他类型的建议或推荐。请阅读使用条款了解更多信息。