
-BTC has been fairly flat the last two weeks as volatility has subsided to monthly lows
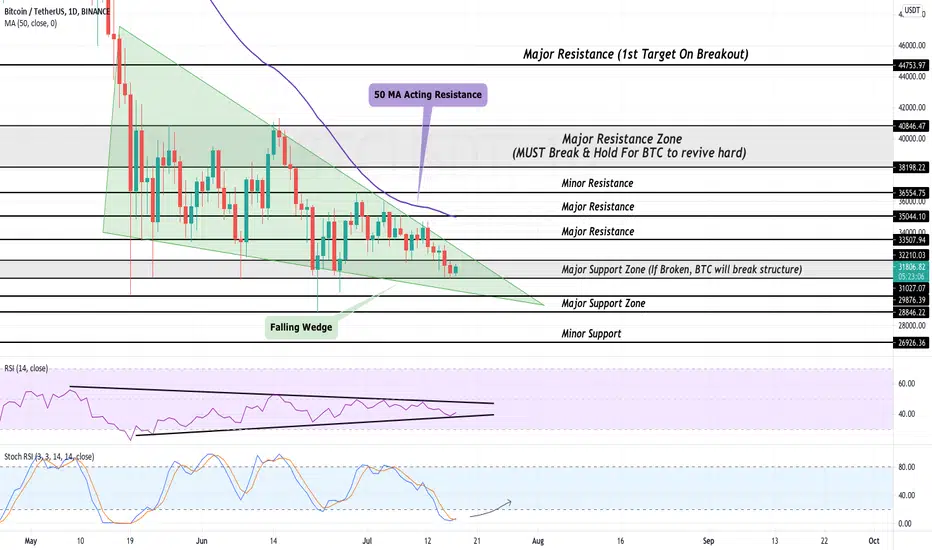
-Price has formed a 2 month long falling wedge pattern
-50 MA has acted as resistance for almost 3 months
Bitcoin’s price action has been super flat the last 2 months ever since the -50% drop off highs. Bulls and bears have been equally controlling price action which has led to a large sideways consolidation. This has left many investors & traders at a lost of interest as this is not a good price action to trade as which a clear direction is lacking. A newly spotted price pattern may give a hint of how much time BTC will have a lack of trend.
Shown in green, a falling wedge has clearly formed after many weeks of bouncing back and forth. This pattern is a generally bullish one but always has the chance of breaking to the downside. A clear breakout & preferably a retest of that trend will likely cause price to follow in that direction. At the time of writing, BTC is sitting within its major support zone of $31,000-$32,200. A break below this zone will likely cause a cascade of selling which would bearishly break the falling wedge pattern. In this case, support will be found at $30,000, $28,800 & $26,900.
For a bullish trend to begin, BTC must break back over its major resistance of $33,500 & hold above. If this occurs, it would be a confirmed upwards break of the falling wedge pattern which will likely start a short term bull trend. In this case, bulls must then tackle the 50 Day MA (purple) which has held price down ever since the $50,000 region.
While looking at the RSI, we can see it has been fairly flat, stuck between the 30 & 50 value. This has created a triangle like formation which shows a breakout to be within a week time. The Stochastic RSI has been sitting in oversold territory for nearly 4 days. At the time of writing, it is showing an upwards curve which looks primed for a strong breakout to the upside. A break above the 20 value will likely start a short term bullish trend. BTC intraday levels
Spot rate: $31,750
Trend: Bearish
Volatility: Low
Support: $31,000
Resistance: $32,200
-Price has formed a 2 month long falling wedge pattern
-50 MA has acted as resistance for almost 3 months
Bitcoin’s price action has been super flat the last 2 months ever since the -50% drop off highs. Bulls and bears have been equally controlling price action which has led to a large sideways consolidation. This has left many investors & traders at a lost of interest as this is not a good price action to trade as which a clear direction is lacking. A newly spotted price pattern may give a hint of how much time BTC will have a lack of trend.
Shown in green, a falling wedge has clearly formed after many weeks of bouncing back and forth. This pattern is a generally bullish one but always has the chance of breaking to the downside. A clear breakout & preferably a retest of that trend will likely cause price to follow in that direction. At the time of writing, BTC is sitting within its major support zone of $31,000-$32,200. A break below this zone will likely cause a cascade of selling which would bearishly break the falling wedge pattern. In this case, support will be found at $30,000, $28,800 & $26,900.
For a bullish trend to begin, BTC must break back over its major resistance of $33,500 & hold above. If this occurs, it would be a confirmed upwards break of the falling wedge pattern which will likely start a short term bull trend. In this case, bulls must then tackle the 50 Day MA (purple) which has held price down ever since the $50,000 region.
While looking at the RSI, we can see it has been fairly flat, stuck between the 30 & 50 value. This has created a triangle like formation which shows a breakout to be within a week time. The Stochastic RSI has been sitting in oversold territory for nearly 4 days. At the time of writing, it is showing an upwards curve which looks primed for a strong breakout to the upside. A break above the 20 value will likely start a short term bullish trend. BTC intraday levels
Spot rate: $31,750
Trend: Bearish
Volatility: Low
Support: $31,000
Resistance: $32,200
注释
Please share your thoughts below!
免责声明
这些信息和出版物并非旨在提供,也不构成TradingView提供或认可的任何形式的财务、投资、交易或其他类型的建议或推荐。请阅读使用条款了解更多信息。