
Disclaimer: In the past, my analyses have frequently deviated due to the erratic movements of BTC whales. Therefore, I advise you to read this study not as investment advice, but purely as a technical explanation.
With growing institutional interest in BTC (ETFs, corporate investments, etc.), I hope it will gain more stable potential. For this reason, I expect it to exhibit fewer "erratic" movements and become more predictable compared to the past. However, the manipulative strategies of large investors, whom we call "whales," have always been devastating for retail investors. Still, money talks, and we can't predict how whales will move. When taking a position, if you are not a large investor, I recommend you never forget that you are a small fish.
With the hope of long-term stability supported by ETFs and institutional investors, we can begin to examine BTC using classic technical tools.
When we look at the monthly timeframe over a wide period, a typical Elliott Wave structure stands out:

In compliance with all impulse rules, I believe BTC is about to complete the 5th wave. But when we look at the momentum oscillators, do they confirm this 5th wave?

Looking at the RSI value, while the price makes a new high, the RSI has formed a lower high. This indicates a bearish divergence.
If we were to check for a signal of a trend reversal or a decrease in wallet data:

Neither the wallet data nor the transaction volumes show an outlook that supports the chart's positive sentiment. Based solely on this data, it's plausible to say that a downtrend might begin.
I recommend that instead of immediately interpreting upward breaks at these levels as a "bull trend," you should first confirm whether it's a fakeout.
Volume and money flow indicators are signaling a clear lack of interest, consolidation, and energy accumulation. This environment provides a very suitable ground for a potential climactic volume. The longer the consolidation and low volume, the more violent the subsequent move can be.

Here too, the negative divergence is clearly visible.
In summary: Although the market appears strong and healthy from the outside, it is exhibiting an uptrend that is running out of energy from the inside. The record-breaking prices are creating a dissonant picture with the decreasing money flow and weakening volume momentum. This increases the probability that the trend is not sustainable and may soon experience exhaustion, a correction, or a reversal.

The ADX shows that the trend still maintains its strength.
The Aroon indicator signals that buyers remain strong while sellers continue to weaken.
When we include the Bollinger Bands and Keltner Channel, an interesting picture emerges:
Price-Volume-Momentum indicators → signal risk.
ADX, Aroon, Bollinger, and Keltner → suggest the trend remains strong.
As I said at the beginning, BTC has always had its "erratic" movements. We can interpret this contradiction as the schizophrenic behavior of an "anarchist" asset.
In short, in my opinion, the trend is not strong; on the contrary, it is weakening, and the chart does not fully reflect reality. However, we cannot say that the trend is completely over either. In a trend that seems to be forcing its way up, avoiding FOMO (Fear Of Missing Out) would be the wisest strategy.
Strategy and Risk Management
If you open a short position, you risk getting caught in a climactic volume, which is highly risky.
If you open a long position, you might find yourself falling off a cliff on the back of the trend after the final surges.
Therefore, what will protect you more than my or any other analyst's comments are your own stop-loss and take-profit strategies.
If the price moves upward contrary to my expectation, your loss would actually be "a profit you never had." However, if you remain in a trend that is about to fall, you are risking your existing capital. That is the real danger.
Always act based on your own observations; do not invest based on rumors. Proceed by taking minimum risk.
A potential M-Top (Double Top) formation is visible, nearing completion within the Bollinger and Keltner channels. The steps of the candle spikes on the band ("walking the bands") are clearly evident.

You can confirm whether the M-Top will complete—and whether it is truly an M-Top—with a monthly close below the current candle's low. If the closes extend down to the Bollinger Band (BB) midline, the possibility of the uptrend reaching figures like 160k–200k–300k would be eliminated, at least for this season.
For those willing to take risks:
It might be logical to determine a position at levels where the BB midline acts as support during the corrective moves that follow this close.
In a continued decline, the loss would be minimal.
In a newly emerging trend, maximum profit could be captured.
Indicators can be misleading when prices are at their peak. That's why I tried to interpret the indicators on the monthly period, as it is less prone to manipulation.
In terms of chart and candle patterns, my first impression on the monthly chart is these two candles, which I believe will form an Evening Star formation.

Before pointing to this formation, I want to draw attention to the harmonic pattern that the candle I suspect will form the Evening Star is drawing on the weekly timeframe.

If we assume that the yet-to-be-completed D-leg of the weekly harmonic pattern (which is forming within the monthly Evening Star) will find support at the Fibonacci 1.27 - 1.24 levels, in alignment with past accumulation zones, we can expect a chart like this to emerge in the coming weeks:

This means we could expect a resistance test between 132K and 127K on the retest of the harmonic pattern. If the simulation I've tried to draw materializes in line with technical measurements, the monthly Evening Star candle formation will also have been completed, thanks to the fractal harmonic pattern.

This would provide a confirmation that we can combine with many other patterns like the hanging man, double top, bull trap, etc.
Literally, this formation is expected to cause a decline. In that case, it could be a formational confirmation that substantiates the explanations we mentioned in the indicators section, such as climactic volume and fakeouts.
Of course, what I have said are inferences based on existing structures that have not yet occurred. This is a simulation graphic. I am trying to catch nascent formations to provide a perspective on potential future scenarios.
As we continue to simulate formations on the monthly period, another harmonic pattern, consistent with our previous measurements and analysis, can give us an idea about old supply zones.

The harmonic pattern above is the main pattern that encompasses the Evening Star and double top formations. In a way that supports the signals from indicators and oscillators, it can inform us about the support zones where prices might retreat.
Looking back, we can also see chart formations that literally told us the levels today's prices might reach.

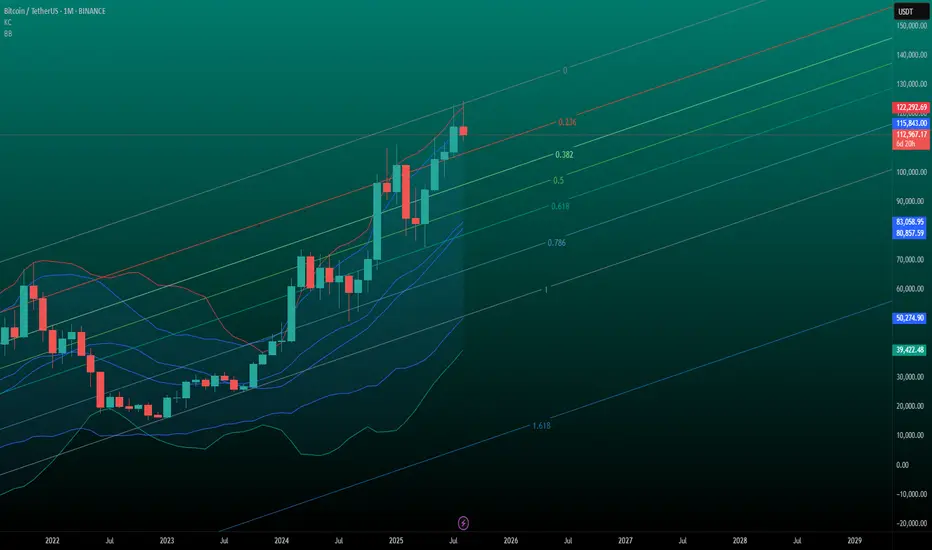
When we depict the all-time price movements within a Fibonacci channel on the weekly timeframe, the all-time accumulation zones become apparent. Based on this channel data, we can predict that a potential retest could occur slightly below the 90K levels.

If, contrary to our expectations, prices form a new upward trend, I believe a new trend channel will form after the 140K levels by following this channel.
Note: This analysis is for informational purposes only and does not constitute investment advice.
With growing institutional interest in BTC (ETFs, corporate investments, etc.), I hope it will gain more stable potential. For this reason, I expect it to exhibit fewer "erratic" movements and become more predictable compared to the past. However, the manipulative strategies of large investors, whom we call "whales," have always been devastating for retail investors. Still, money talks, and we can't predict how whales will move. When taking a position, if you are not a large investor, I recommend you never forget that you are a small fish.
With the hope of long-term stability supported by ETFs and institutional investors, we can begin to examine BTC using classic technical tools.
When we look at the monthly timeframe over a wide period, a typical Elliott Wave structure stands out:
In compliance with all impulse rules, I believe BTC is about to complete the 5th wave. But when we look at the momentum oscillators, do they confirm this 5th wave?
Looking at the RSI value, while the price makes a new high, the RSI has formed a lower high. This indicates a bearish divergence.
If we were to check for a signal of a trend reversal or a decrease in wallet data:
Neither the wallet data nor the transaction volumes show an outlook that supports the chart's positive sentiment. Based solely on this data, it's plausible to say that a downtrend might begin.
I recommend that instead of immediately interpreting upward breaks at these levels as a "bull trend," you should first confirm whether it's a fakeout.
Volume and money flow indicators are signaling a clear lack of interest, consolidation, and energy accumulation. This environment provides a very suitable ground for a potential climactic volume. The longer the consolidation and low volume, the more violent the subsequent move can be.
Here too, the negative divergence is clearly visible.
In summary: Although the market appears strong and healthy from the outside, it is exhibiting an uptrend that is running out of energy from the inside. The record-breaking prices are creating a dissonant picture with the decreasing money flow and weakening volume momentum. This increases the probability that the trend is not sustainable and may soon experience exhaustion, a correction, or a reversal.
The ADX shows that the trend still maintains its strength.
The Aroon indicator signals that buyers remain strong while sellers continue to weaken.
When we include the Bollinger Bands and Keltner Channel, an interesting picture emerges:
Price-Volume-Momentum indicators → signal risk.
ADX, Aroon, Bollinger, and Keltner → suggest the trend remains strong.
As I said at the beginning, BTC has always had its "erratic" movements. We can interpret this contradiction as the schizophrenic behavior of an "anarchist" asset.
In short, in my opinion, the trend is not strong; on the contrary, it is weakening, and the chart does not fully reflect reality. However, we cannot say that the trend is completely over either. In a trend that seems to be forcing its way up, avoiding FOMO (Fear Of Missing Out) would be the wisest strategy.
Strategy and Risk Management
If you open a short position, you risk getting caught in a climactic volume, which is highly risky.
If you open a long position, you might find yourself falling off a cliff on the back of the trend after the final surges.
Therefore, what will protect you more than my or any other analyst's comments are your own stop-loss and take-profit strategies.
If the price moves upward contrary to my expectation, your loss would actually be "a profit you never had." However, if you remain in a trend that is about to fall, you are risking your existing capital. That is the real danger.
Always act based on your own observations; do not invest based on rumors. Proceed by taking minimum risk.
A potential M-Top (Double Top) formation is visible, nearing completion within the Bollinger and Keltner channels. The steps of the candle spikes on the band ("walking the bands") are clearly evident.
You can confirm whether the M-Top will complete—and whether it is truly an M-Top—with a monthly close below the current candle's low. If the closes extend down to the Bollinger Band (BB) midline, the possibility of the uptrend reaching figures like 160k–200k–300k would be eliminated, at least for this season.
For those willing to take risks:
It might be logical to determine a position at levels where the BB midline acts as support during the corrective moves that follow this close.
In a continued decline, the loss would be minimal.
In a newly emerging trend, maximum profit could be captured.
Indicators can be misleading when prices are at their peak. That's why I tried to interpret the indicators on the monthly period, as it is less prone to manipulation.
In terms of chart and candle patterns, my first impression on the monthly chart is these two candles, which I believe will form an Evening Star formation.
Before pointing to this formation, I want to draw attention to the harmonic pattern that the candle I suspect will form the Evening Star is drawing on the weekly timeframe.
If we assume that the yet-to-be-completed D-leg of the weekly harmonic pattern (which is forming within the monthly Evening Star) will find support at the Fibonacci 1.27 - 1.24 levels, in alignment with past accumulation zones, we can expect a chart like this to emerge in the coming weeks:
This means we could expect a resistance test between 132K and 127K on the retest of the harmonic pattern. If the simulation I've tried to draw materializes in line with technical measurements, the monthly Evening Star candle formation will also have been completed, thanks to the fractal harmonic pattern.
This would provide a confirmation that we can combine with many other patterns like the hanging man, double top, bull trap, etc.
Literally, this formation is expected to cause a decline. In that case, it could be a formational confirmation that substantiates the explanations we mentioned in the indicators section, such as climactic volume and fakeouts.
Of course, what I have said are inferences based on existing structures that have not yet occurred. This is a simulation graphic. I am trying to catch nascent formations to provide a perspective on potential future scenarios.
As we continue to simulate formations on the monthly period, another harmonic pattern, consistent with our previous measurements and analysis, can give us an idea about old supply zones.
The harmonic pattern above is the main pattern that encompasses the Evening Star and double top formations. In a way that supports the signals from indicators and oscillators, it can inform us about the support zones where prices might retreat.
Looking back, we can also see chart formations that literally told us the levels today's prices might reach.
When we depict the all-time price movements within a Fibonacci channel on the weekly timeframe, the all-time accumulation zones become apparent. Based on this channel data, we can predict that a potential retest could occur slightly below the 90K levels.
If, contrary to our expectations, prices form a new upward trend, I believe a new trend channel will form after the 140K levels by following this channel.
Note: This analysis is for informational purposes only and does not constitute investment advice.

免责声明
这些信息和出版物并非旨在提供,也不构成TradingView提供或认可的任何形式的财务、投资、交易或其他类型的建议或推荐。请阅读使用条款了解更多信息。
免责声明
这些信息和出版物并非旨在提供,也不构成TradingView提供或认可的任何形式的财务、投资、交易或其他类型的建议或推荐。请阅读使用条款了解更多信息。