
Hello every one
🟡WHAT IS A FALLING WEDGE PATTERN?
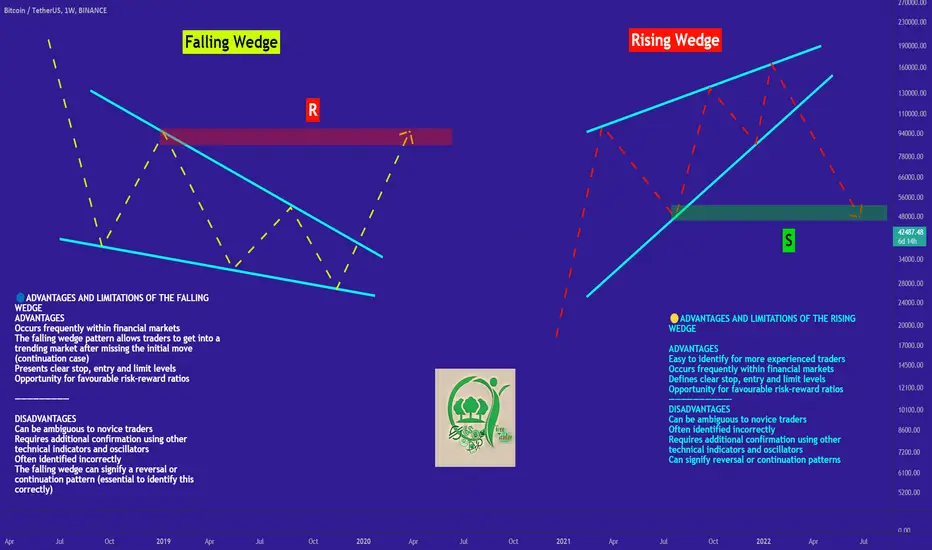
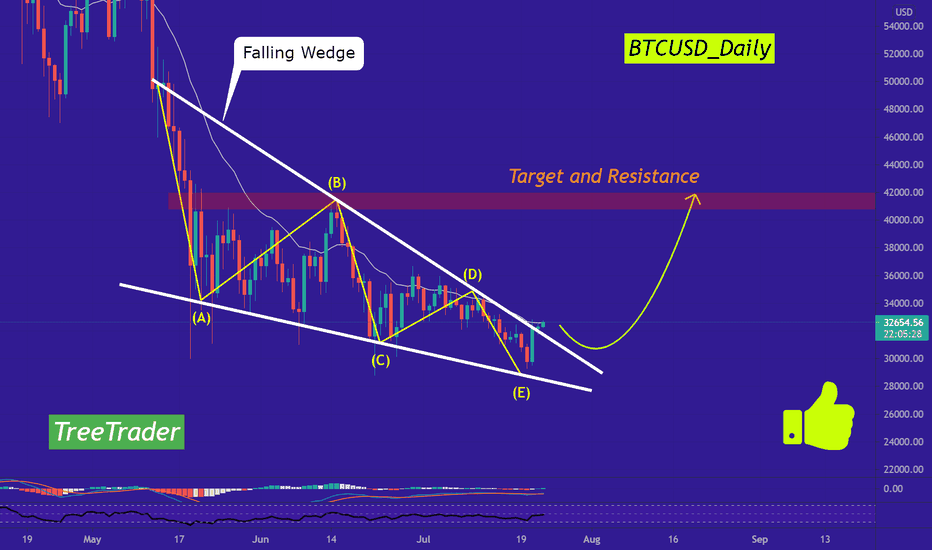
The falling wedge pattern is a continuation pattern formed when price bounces between two downward sloping, converging trendlines. It is considered a bullish chart formation but can indicate both reversal and continuation patterns – depending on where it appears in the trend.
🌳HOW TO IDENTIFY A FALLING WEDGE PATTERN
The falling wedge pattern is interpreted as both a bullish continuation and bullish reversal pattern which gives rise to some confusion in the identification of the pattern. Both scenarios contain different market conditions which must be taken into consideration.
The differentiating factor that separates the continuation and reversal pattern is the direction of the trend when the falling wedge appears. A falling wedge is a continuation pattern if it appears in an uptrend and is a reversal pattern when it appears in a downtrend.
(Example)
🔵WHAT IS A RISING WEDGE PATTERN?
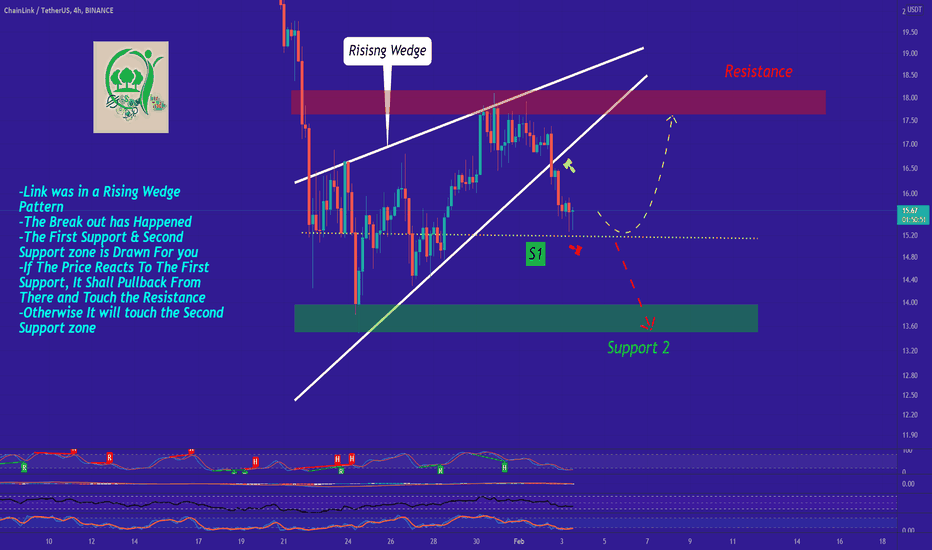
The rising wedge (also known as the ascending wedge) pattern is a powerful consolidation price pattern formed when price is bound between two rising trend lines. It is considered a bearish chart formation which can indicate both reversal and continuation patterns – depending on location and trend bias. Regardless of where the rising wedge appears, traders should always maintain the guideline that this pattern is inherently bearish in nature
🌳HOW TO IDENTIFY A RISING WEDGE PATTERN
The rising wedge pattern is interpreted as both a bearish continuation and bearish reversal pattern which gives rise to some confusion in the identification of the pattern. Both scenarios contain a different set of observation dynamics which must be taken into consideration.
(Example)
🟡WHAT IS A FALLING WEDGE PATTERN?
The falling wedge pattern is a continuation pattern formed when price bounces between two downward sloping, converging trendlines. It is considered a bullish chart formation but can indicate both reversal and continuation patterns – depending on where it appears in the trend.
🌳HOW TO IDENTIFY A FALLING WEDGE PATTERN
The falling wedge pattern is interpreted as both a bullish continuation and bullish reversal pattern which gives rise to some confusion in the identification of the pattern. Both scenarios contain different market conditions which must be taken into consideration.
The differentiating factor that separates the continuation and reversal pattern is the direction of the trend when the falling wedge appears. A falling wedge is a continuation pattern if it appears in an uptrend and is a reversal pattern when it appears in a downtrend.
(Example)
🔵WHAT IS A RISING WEDGE PATTERN?
The rising wedge (also known as the ascending wedge) pattern is a powerful consolidation price pattern formed when price is bound between two rising trend lines. It is considered a bearish chart formation which can indicate both reversal and continuation patterns – depending on location and trend bias. Regardless of where the rising wedge appears, traders should always maintain the guideline that this pattern is inherently bearish in nature
🌳HOW TO IDENTIFY A RISING WEDGE PATTERN
The rising wedge pattern is interpreted as both a bearish continuation and bearish reversal pattern which gives rise to some confusion in the identification of the pattern. Both scenarios contain a different set of observation dynamics which must be taken into consideration.
(Example)

免责声明
这些信息和出版物并非旨在提供,也不构成TradingView提供或认可的任何形式的财务、投资、交易或其他类型的建议或推荐。请阅读使用条款了解更多信息。
免责声明
这些信息和出版物并非旨在提供,也不构成TradingView提供或认可的任何形式的财务、投资、交易或其他类型的建议或推荐。请阅读使用条款了解更多信息。