
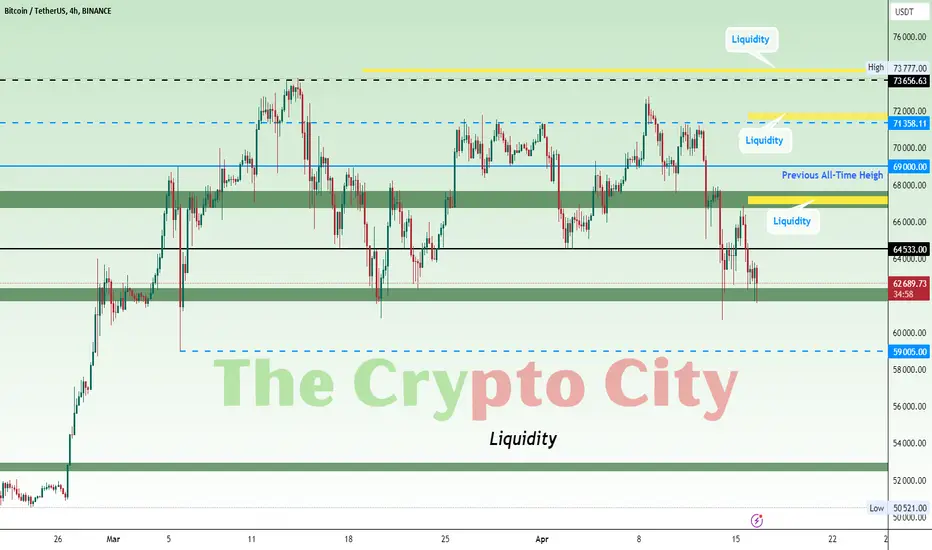
Look at the chart BTC is at the crucial support zone marked as green zone at $62.4k, if it breaks this zone you see 1 more leg down to $59,005, and if this level does not hold we can see 1 more leg down to the green zone marked at $52,923. There is much liquidity resting in between 52k and 59k. More chances are we can pull back from $59,005 or between.
On the chart we marked liquidity in yellow after a pullback it will take that liquidity and we see BTC testing highs again. According to the Bitcoin Exchange Liquidation Map approximately $8.76B liquidity is resting upside
Previously we told you liquidity lying above at $72,353 in our post and in our last video and after grabbing that liquidity BTC came down and it followed the plan as we predicted.
On the chart we marked liquidity in yellow after a pullback it will take that liquidity and we see BTC testing highs again. According to the Bitcoin Exchange Liquidation Map approximately $8.76B liquidity is resting upside
Previously we told you liquidity lying above at $72,353 in our post and in our last video and after grabbing that liquidity BTC came down and it followed the plan as we predicted.

免责声明
这些信息和出版物并非旨在提供,也不构成TradingView提供或认可的任何形式的财务、投资、交易或其他类型的建议或推荐。请阅读使用条款了解更多信息。
免责声明
这些信息和出版物并非旨在提供,也不构成TradingView提供或认可的任何形式的财务、投资、交易或其他类型的建议或推荐。请阅读使用条款了解更多信息。