
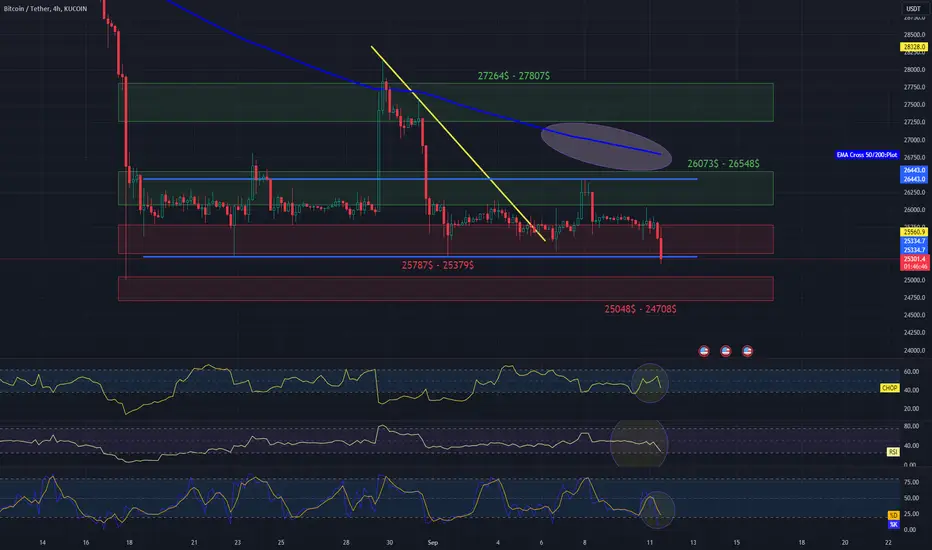
Hello everyone, I invite you to review the current situation on BTC in the USDT pair, taking into account the four-hour interval. First, we will use the yellow line to mark the local downward trend line from which the price has moved sideways, but at this point it is worth marking the sideways trend channel in which the price moves at the lower border with blue lines.
When we turn on EMA Cross 200, we see that the exit attempt was unsuccessful and we are still in the ongoing downward trend.
Now we can move on to marking support areas in the event of a correction. For this purpose, we will use the trend based fib extension tool. And here, first of all, it is worth marking the support zone from $25,787 to $25,379, where the price currently holds, but when we fall below this zone, we may see a drop to the area around the second zone from $25,048 to $24,708.
Looking the other way, we can determine resistance areas in a similar way. First, we will mark the resistance zone from $26,073 to $26,548, where the price increase has been rejected, when it is overcome, we have a second significant zone from $27,264 to $27,807.
Please pay attention to the CHOP index, which indicates that more and more energy is being collected for the movement, on the RSI we see a visible rebound to the lower part of the range, but with room for the price to go slightly lower, while the STOCH indicator also indicates that energy has been used up, but a quick rebound of energy may give a further drop to the price in the coming hours.

免责声明
这些信息和出版物并非旨在提供,也不构成TradingView提供或认可的任何形式的财务、投资、交易或其他类型的建议或推荐。请阅读使用条款了解更多信息。
免责声明
这些信息和出版物并非旨在提供,也不构成TradingView提供或认可的任何形式的财务、投资、交易或其他类型的建议或推荐。请阅读使用条款了解更多信息。