
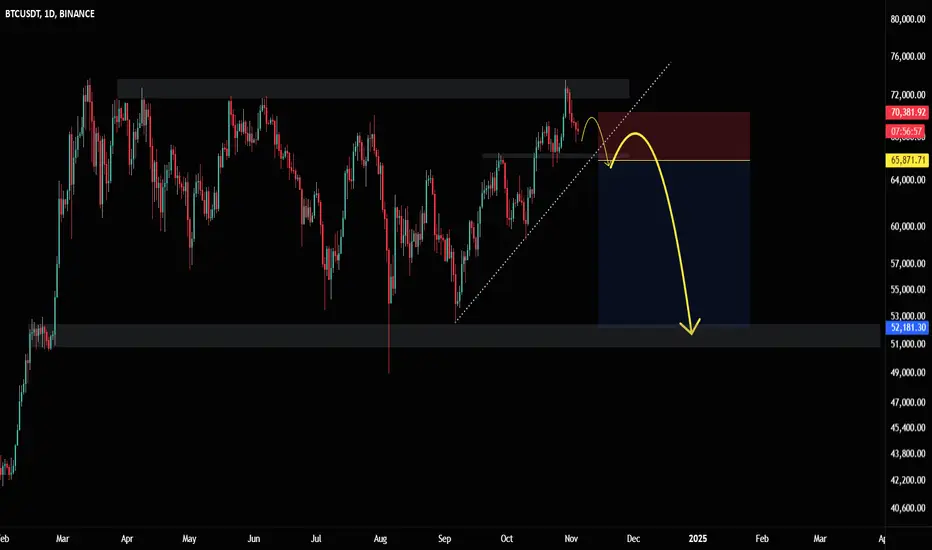
This chart shows Bitcoin to USDT (BTC/USDT) on the daily timeframe (1D), displaying a bearish scenario. In this analysis, a strong resistance zone (grey box on top) is identified, where the price has repeatedly failed to break through.
Uptrend Line (dotted white line) appears to be on the verge of breaking, indicating weakening buyer momentum.
Given the strong resistance and the recent rejection from this level, there is a high probability of the uptrend line breaking.
The expected scenario is that after breaking this trendline and retesting the red zone as a new resistance, the price will start a strong downward move towards the lower support zone (grey box below).
The final target for this analysis is around $53,000, which is a key support level.
This analysis assumes that buyers are losing control at these high levels, and there’s a likelihood of a pullback to the lower support level.

免责声明
这些信息和出版物并非旨在提供,也不构成TradingView提供或认可的任何形式的财务、投资、交易或其他类型的建议或推荐。请阅读使用条款了解更多信息。
免责声明
这些信息和出版物并非旨在提供,也不构成TradingView提供或认可的任何形式的财务、投资、交易或其他类型的建议或推荐。请阅读使用条款了解更多信息。