
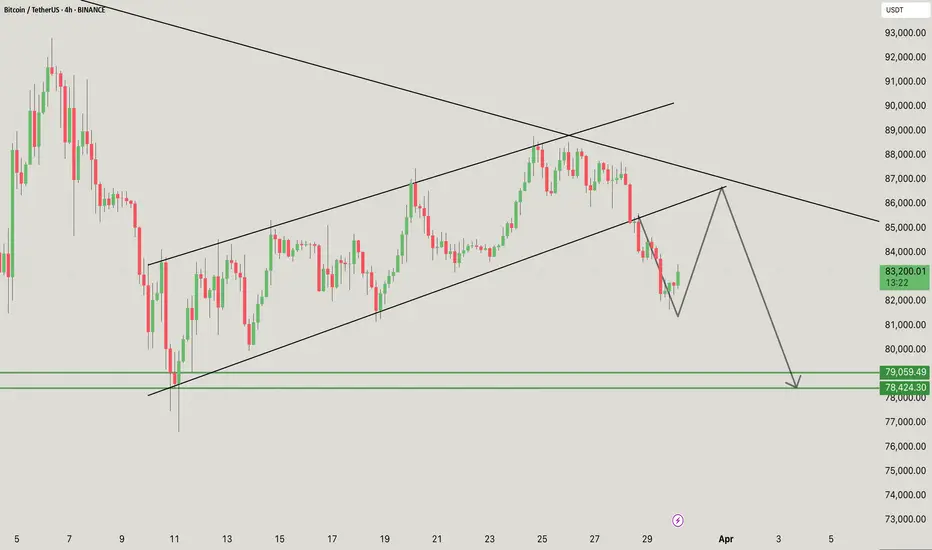
The chart shows Bitcoin (BTC) previously trading within an ascending channel (marked by two parallel black lines).
Recently, BTC broke below this channel, signaling a bearish shift in momentum.
BTC is currently attempting to retest the lower boundary of the broken channel.
This is critical—if BTC fails to reclaim the channel, it could confirm a downtrend continuation.
The chart suggests a possible short-term bounce toward resistance around $85,000-$86,000.
However, after this retest, BTC is expected to drop sharply toward $79,000 - $78,400 (green support zone).
$79,059 & $78,424 are identified as key support zones.
If BTC reaches these levels and holds, a rebound is possible.
If broken, BTC could see a deeper decline toward lower levels.
Breakout invalidation: If BTC breaks above $86,000 with strong volume, it could regain bullish momentum and move higher.
If you found this analysis helpful, hit the Like button and share your thoughts or questions in the comments below. Your feedback matters!
Thanks for your support!
DYOR. NFA

相关出版物
免责声明
这些信息和出版物并非旨在提供,也不构成TradingView提供或认可的任何形式的财务、投资、交易或其他类型的建议或推荐。请阅读使用条款了解更多信息。