
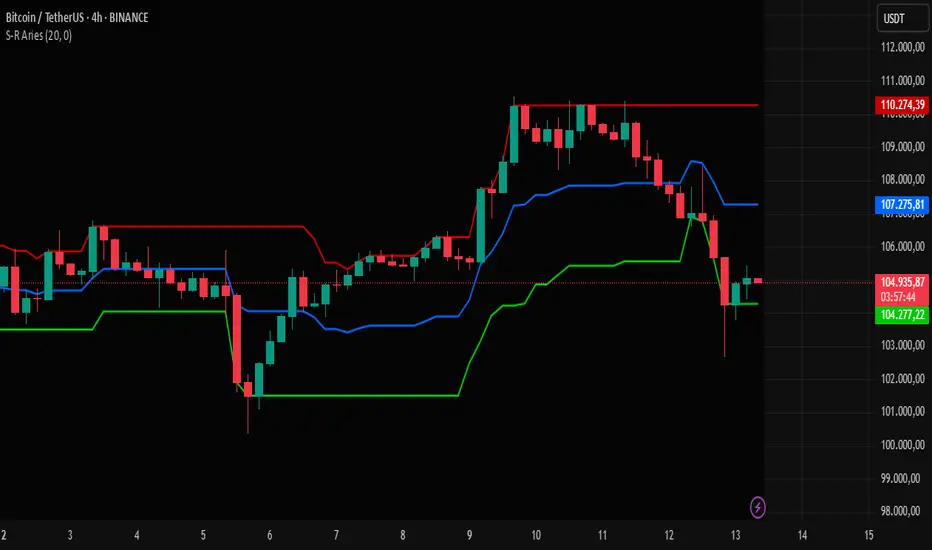
This indicator is designed to identify dynamic levels of support, resistance, and a midpoint based on closing prices over a specific period. It provides a clear visual structure to help traders recognize key areas where the market may react.
How It Works:
Calculation Period:
The user selects the number of candles to analyze for determining the levels. The default value is 20, and it can range from 1 to 200.
Calculations:
Resistance: the highest closing price within the selected period.
Support: the lowest closing price within the same period.
Midline: the simple average between the support and resistance levels.
Chart Display:
Three horizontal lines are plotted directly on the price chart:
Green line for support
Red line for resistance
Blue line for the midpoint
These lines help identify potential zones of:
Reversal
Consolidation
Breakout
Chart Background:
The chart background can be colored using a user-defined color.
The "Background Offset" setting allows this background color to be applied with a delay, avoiding overlap with the most recent candles and keeping the view clean.
Practical Applications:
Useful for trend reversal strategies, breakout setups, or simply analyzing market structure.
Effective across all timeframes, from intraday to weekly charts.
Can be used as a foundation for automated systems like grid bots or breakout alerts.
Visual Style and Usability:
The use of distinct colors (green, red, and blue) ensures quick and clear interpretation.
A clean, minimalistic layout focused on delivering objective information without cluttering the chart.
How It Works:
Calculation Period:
The user selects the number of candles to analyze for determining the levels. The default value is 20, and it can range from 1 to 200.
Calculations:
Resistance: the highest closing price within the selected period.
Support: the lowest closing price within the same period.
Midline: the simple average between the support and resistance levels.
Chart Display:
Three horizontal lines are plotted directly on the price chart:
Green line for support
Red line for resistance
Blue line for the midpoint
These lines help identify potential zones of:
Reversal
Consolidation
Breakout
Chart Background:
The chart background can be colored using a user-defined color.
The "Background Offset" setting allows this background color to be applied with a delay, avoiding overlap with the most recent candles and keeping the view clean.
Practical Applications:
Useful for trend reversal strategies, breakout setups, or simply analyzing market structure.
Effective across all timeframes, from intraday to weekly charts.
Can be used as a foundation for automated systems like grid bots or breakout alerts.
Visual Style and Usability:
The use of distinct colors (green, red, and blue) ensures quick and clear interpretation.
A clean, minimalistic layout focused on delivering objective information without cluttering the chart.

免责声明
这些信息和出版物并非旨在提供,也不构成TradingView提供或认可的任何形式的财务、投资、交易或其他类型的建议或推荐。请阅读使用条款了解更多信息。
免责声明
这些信息和出版物并非旨在提供,也不构成TradingView提供或认可的任何形式的财务、投资、交易或其他类型的建议或推荐。请阅读使用条款了解更多信息。