
Over the last couple of week's I've been very bullish on the market. My 40.000 thesis for this year is still my personal most likely scenario, but that doesn't mean that we can't look at the market from a more bearish perspective.
So, in this analysis I want to take a look at a bearish Bitcoin scenario that might be playing out at the moment. Bitcoin might be trading in a Wyckoff distribution pattern.
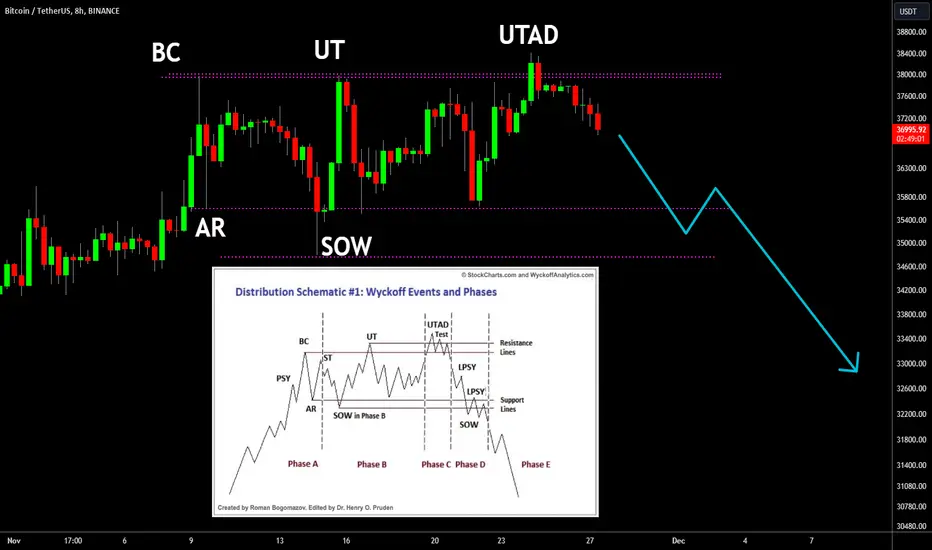
As seen on the chart, the BC/UT/UTAD are nearly identical as on the schematic. Three higher-highs, of which the first two are sold off quickly, and the last (UTAD) took a while before it turned bearish.
AR and SOW are also fairly identical to the schematic. Difference is that we had two retests of the AR-low between UT and UTAD. In the end, the schematic is just a schematic and the market will rarely follow it exactly. I'm interpreting it more as a guideline instead of an exact science.
Were this pattern to play out, Bitcoin will likely retest the SOW area in the near future, and likely fall through the SOW support. This would also mean that 38.4k is the 2023 top, with a move towards 30.000$ being fairly likely.
Like mentioned before, I'm still bullish on the market. However, it's important to spot bearish signs when they are there. The fact that we had three higher-highs which were all sold off is alarming at the very least. Time will tell if this pattern will play out. For now, keep your eyes open and be watchful.
Share your thoughts in the comments, interested to see what the community thinks of this pattern.🙏
So, in this analysis I want to take a look at a bearish Bitcoin scenario that might be playing out at the moment. Bitcoin might be trading in a Wyckoff distribution pattern.
As seen on the chart, the BC/UT/UTAD are nearly identical as on the schematic. Three higher-highs, of which the first two are sold off quickly, and the last (UTAD) took a while before it turned bearish.
AR and SOW are also fairly identical to the schematic. Difference is that we had two retests of the AR-low between UT and UTAD. In the end, the schematic is just a schematic and the market will rarely follow it exactly. I'm interpreting it more as a guideline instead of an exact science.
Were this pattern to play out, Bitcoin will likely retest the SOW area in the near future, and likely fall through the SOW support. This would also mean that 38.4k is the 2023 top, with a move towards 30.000$ being fairly likely.
Like mentioned before, I'm still bullish on the market. However, it's important to spot bearish signs when they are there. The fact that we had three higher-highs which were all sold off is alarming at the very least. Time will tell if this pattern will play out. For now, keep your eyes open and be watchful.
Share your thoughts in the comments, interested to see what the community thinks of this pattern.🙏
注释
As described, my most likely scenario was still a bullish break out. Wyckoff pattern was not completed yet and has most likely been invalidated.
🎯Official Channel: t.me/FieryTradingChannel
📈Try my Premium Signals for FREE - 80% Win-Rate: t.me/FT_Futures_free
✅Monster Signals: t.me/monster_cryptosignals
🔥Premium Signals: fierytrading.com
📈Try my Premium Signals for FREE - 80% Win-Rate: t.me/FT_Futures_free
✅Monster Signals: t.me/monster_cryptosignals
🔥Premium Signals: fierytrading.com
相关出版物
免责声明
这些信息和出版物并非旨在提供,也不构成TradingView提供或认可的任何形式的财务、投资、交易或其他类型的建议或推荐。请阅读使用条款了解更多信息。
🎯Official Channel: t.me/FieryTradingChannel
📈Try my Premium Signals for FREE - 80% Win-Rate: t.me/FT_Futures_free
✅Monster Signals: t.me/monster_cryptosignals
🔥Premium Signals: fierytrading.com
📈Try my Premium Signals for FREE - 80% Win-Rate: t.me/FT_Futures_free
✅Monster Signals: t.me/monster_cryptosignals
🔥Premium Signals: fierytrading.com
相关出版物
免责声明
这些信息和出版物并非旨在提供,也不构成TradingView提供或认可的任何形式的财务、投资、交易或其他类型的建议或推荐。请阅读使用条款了解更多信息。