
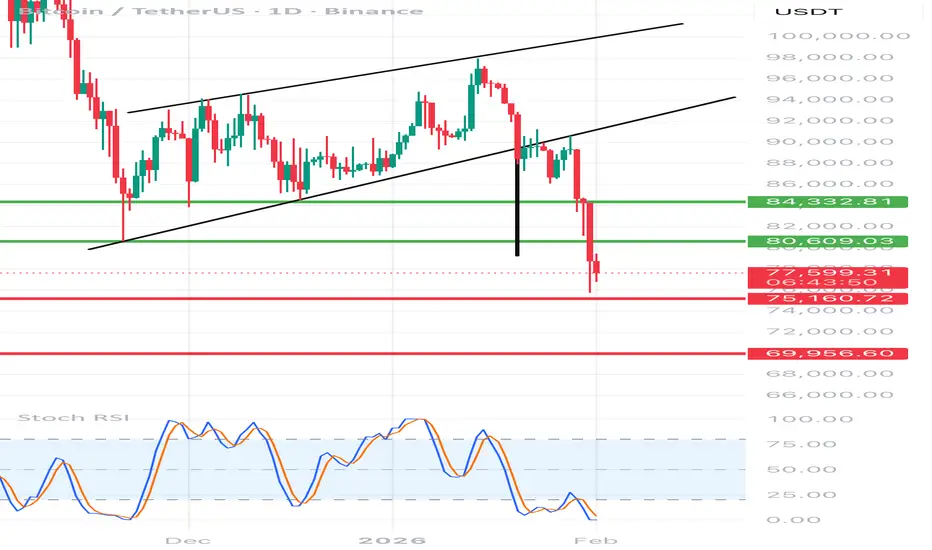
1️⃣ Market Structure
• Previously an ascending channel (higher lows + higher highs)
• A breakout from the channel occurred ➜ the structure changed to a downward one
• The current move is a downward impulse, not a correction
📉 This is no longer a healthy correction in an uptrend
⸻
2️⃣ Key Levels (what you marked)
🟢 Support Zones (now resistance)
• 84,300 – first support → broken
• 80,600 – key support → broken by an impulse
➡️ Both zones after retests = resistance
🔴 Downside Targets
• 75,150 – closest logical target (local low/demand)
• 69,950 – strong demand zone (weekly demand)
➡️ 75k very realistic, 70k possible with panic/news
⸻
3️⃣ Momentum & candles
• Long red impulse candles
• No lower wicks = sellers in full control
• No demand reaction after breaking 80.6k → market weakness
⸻
4️⃣ Stochastic RSI
• Entry into oversold
• BUT ❗
In a downtrend, the Stochastic RSI may stay at the bottom for a long time.
📌 This is not a signal to go long, but rather information that:
• Shorts should be careful of a short bounce
• Longs → scalp only, not swing
⸻
5️⃣ Scenarios (most important)
🔴 Baseline scenario (70–75%)
• Retest of 80–81k from below
• Rejection
• A drop to 75k
• A spike to the bottom is possible 70k
🟡 Alternative scenario (25%)
• Quick rebound to 84k
• Lack of volume
• Another bearish wave
➡️ Until price < 80.6k – BEARISH bias
• Previously an ascending channel (higher lows + higher highs)
• A breakout from the channel occurred ➜ the structure changed to a downward one
• The current move is a downward impulse, not a correction
📉 This is no longer a healthy correction in an uptrend
⸻
2️⃣ Key Levels (what you marked)
🟢 Support Zones (now resistance)
• 84,300 – first support → broken
• 80,600 – key support → broken by an impulse
➡️ Both zones after retests = resistance
🔴 Downside Targets
• 75,150 – closest logical target (local low/demand)
• 69,950 – strong demand zone (weekly demand)
➡️ 75k very realistic, 70k possible with panic/news
⸻
3️⃣ Momentum & candles
• Long red impulse candles
• No lower wicks = sellers in full control
• No demand reaction after breaking 80.6k → market weakness
⸻
4️⃣ Stochastic RSI
• Entry into oversold
• BUT ❗
In a downtrend, the Stochastic RSI may stay at the bottom for a long time.
📌 This is not a signal to go long, but rather information that:
• Shorts should be careful of a short bounce
• Longs → scalp only, not swing
⸻
5️⃣ Scenarios (most important)
🔴 Baseline scenario (70–75%)
• Retest of 80–81k from below
• Rejection
• A drop to 75k
• A spike to the bottom is possible 70k
🟡 Alternative scenario (25%)
• Quick rebound to 84k
• Lack of volume
• Another bearish wave
➡️ Until price < 80.6k – BEARISH bias

免责声明
这些信息和出版物并非旨在提供,也不构成TradingView提供或认可的任何形式的财务、投资、交易或其他类型的建议或推荐。请阅读使用条款了解更多信息。
免责声明
这些信息和出版物并非旨在提供,也不构成TradingView提供或认可的任何形式的财务、投资、交易或其他类型的建议或推荐。请阅读使用条款了解更多信息。