
 BTCUSDT
 Bitcoin — Global Structure
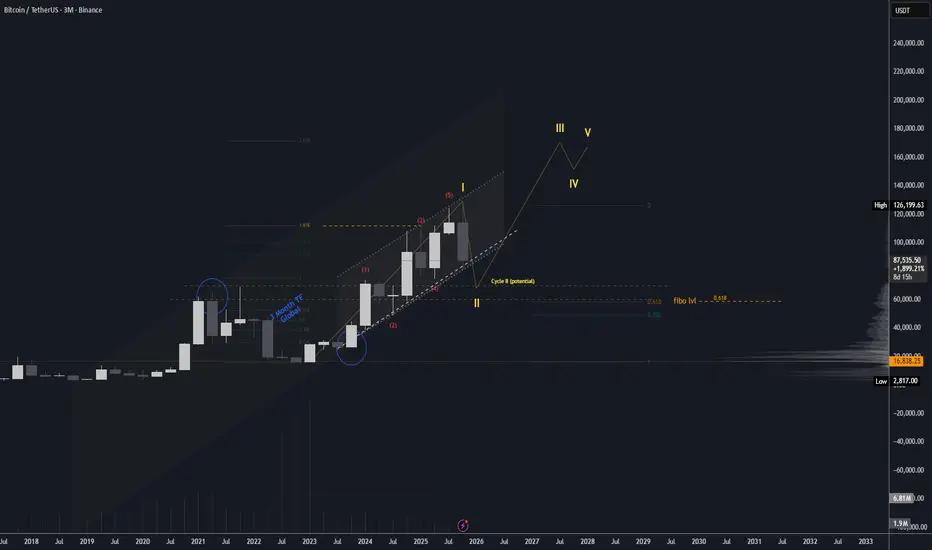
On the 3M timeframe, Bitcoin has formed and confirmed an ascending parallel channel, reacting strongly from its lower boundary and moving toward the opposite side of the structure.
Subsequently, price has remained near the upper boundary of the channel for almost two years. Such prolonged behavior near resistance may indicate impulse exhaustion within the current structure rather than acceleration.
This perspective is supported by wave analysis on the 1W timeframe. Considering market fractality and the formation of nested structures, the current movement aligns with the completion of an impulsive Cycle I wave of a higher degree.
For the cycle to progress, the market may logically transition into a corrective phase (Cycle II). In this scenario, a move outside the parallel channel followed by a decline toward the 0.618 Fibonacci retracement zone (60–70k) appears technically justified. This area is further reinforced by visible volume concentration.
It is also worth noting that the Fibonacci extension measured from the prior impulse shows price reaching the 1.618 level, a zone that often acts as a natural termination point for impulsive waves.
Alternatively, the current structure may suggest that the market is not completing Cycle I, but rather developing a larger wave (III). In that case, Bitcoin would likely maintain strength and continue moving within the channel without a deep corrective phase.
Overall, the current structure presents two primary scenarios, with further development depending on price reaction at the channel boundaries and key structural levels.

免责声明
这些信息和出版物并非旨在提供,也不构成TradingView提供或认可的任何形式的财务、投资、交易或其他类型的建议或推荐。请阅读使用条款了解更多信息。