
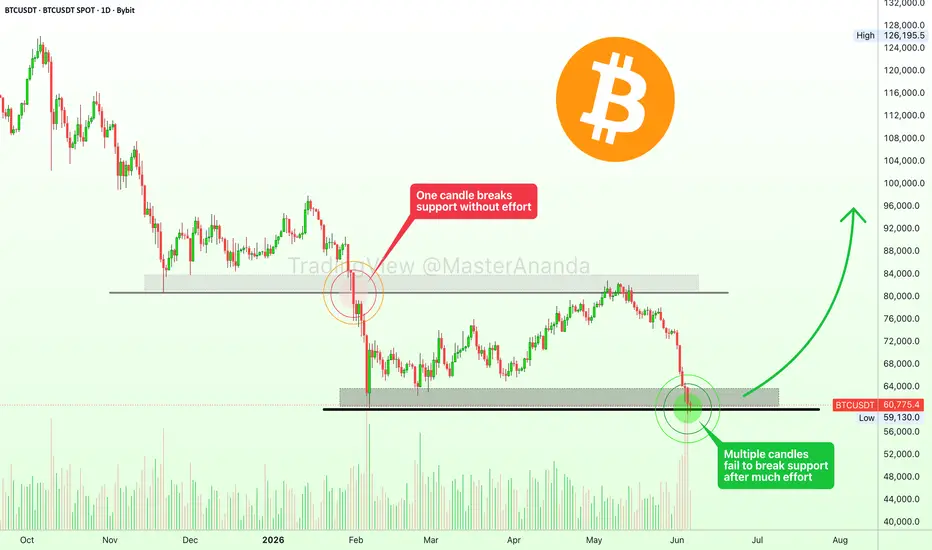
Bitcoin came crashing down from a high point somewhere around early October 2025. The first stop is marked on this chart with a grey line. After this stop and some relief, BTCUSDT moved down breaking the support without any type of resistance. It happened easily and swiftly in one single candle. That is, the $80,000 support was challenged just once and it broke, this led to $60,000.
Fast forward to the present and what do we see?
The second stop is marked on this chart with a black line. After this bottom, BTCUSDT moved to produce a three months long bullish wave, then it started to crash down in correction faction but what happened in January is not being repeated.
Instead of support breaking in a single session, without problem, here support is holding strong even while sellers have been producing massive volume. Three candles already are not able to break this support. Compare to January when just one session cut through support easily. This is how things change.
The struggle and fight around this level shows that conditions are not the same from five months ago. Also notice how the low from November 2025 and February 2026 produce a sideways channel. Compare to the bearish wave starting October 2025.
The bearish wave, a bearish impulse produces lower highs and lower lows—sustained. A sideways period instead, keeps prices within a certain range. This range right now sits between $60,000 and $80,000. First the market goes sideways then we experience change. Expect a new uptrend.
Namaste.
Fast forward to the present and what do we see?
The second stop is marked on this chart with a black line. After this bottom, BTCUSDT moved to produce a three months long bullish wave, then it started to crash down in correction faction but what happened in January is not being repeated.
Instead of support breaking in a single session, without problem, here support is holding strong even while sellers have been producing massive volume. Three candles already are not able to break this support. Compare to January when just one session cut through support easily. This is how things change.
The struggle and fight around this level shows that conditions are not the same from five months ago. Also notice how the low from November 2025 and February 2026 produce a sideways channel. Compare to the bearish wave starting October 2025.
The bearish wave, a bearish impulse produces lower highs and lower lows—sustained. A sideways period instead, keeps prices within a certain range. This range right now sits between $60,000 and $80,000. First the market goes sideways then we experience change. Expect a new uptrend.
Namaste.

Trading Cryptocurrencies can be the hardest undertaking ever without the right trade-numbers, without accurate private-access information. Free is free, but the best always requires sweat, an investment. Since 2017 👇
t.me/masteranandatrades/8778
t.me/masteranandatrades/8778
相关出版物
免责声明
这些信息和出版物并非旨在提供,也不构成TradingView提供或认可的任何形式的财务、投资、交易或其他类型的建议或推荐。请阅读使用条款了解更多信息。
Trading Cryptocurrencies can be the hardest undertaking ever without the right trade-numbers, without accurate private-access information. Free is free, but the best always requires sweat, an investment. Since 2017 👇
t.me/masteranandatrades/8778
t.me/masteranandatrades/8778
相关出版物
免责声明
这些信息和出版物并非旨在提供,也不构成TradingView提供或认可的任何形式的财务、投资、交易或其他类型的建议或推荐。请阅读使用条款了解更多信息。