
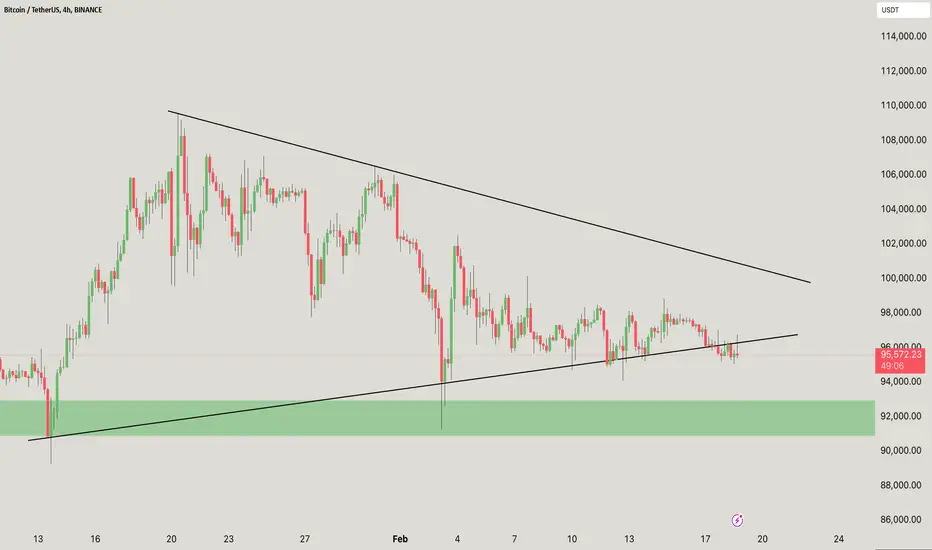
The BTC/USDT chart on the 4H timeframe shows a symmetrical triangle pattern, with price action near the top. Bitcoin is currently testing the lower trendline, a key support level. A breakdown below this level could lead to a decline towards the green demand zone of around $92,000. On the other hand, if BTC manages to hold the support and bounce back, it could attempt another test of the upper resistance trendline.
A decisive breakout in either direction will confirm the next trend. Keep an eye on increased volume to validate any breakout moves.
If you found this analysis helpful, hit the Like button and share your thoughts or questions in the comments below. Your feedback matters!
Thanks for your support!
DYOR. NFA

相关出版物
免责声明
这些信息和出版物并非旨在提供,也不构成TradingView提供或认可的任何形式的财务、投资、交易或其他类型的建议或推荐。请阅读使用条款了解更多信息。