
Hello community,
One of the most powerful indicators added by TradingView recently is the Volume Delta indicator.
Practical Explanations :
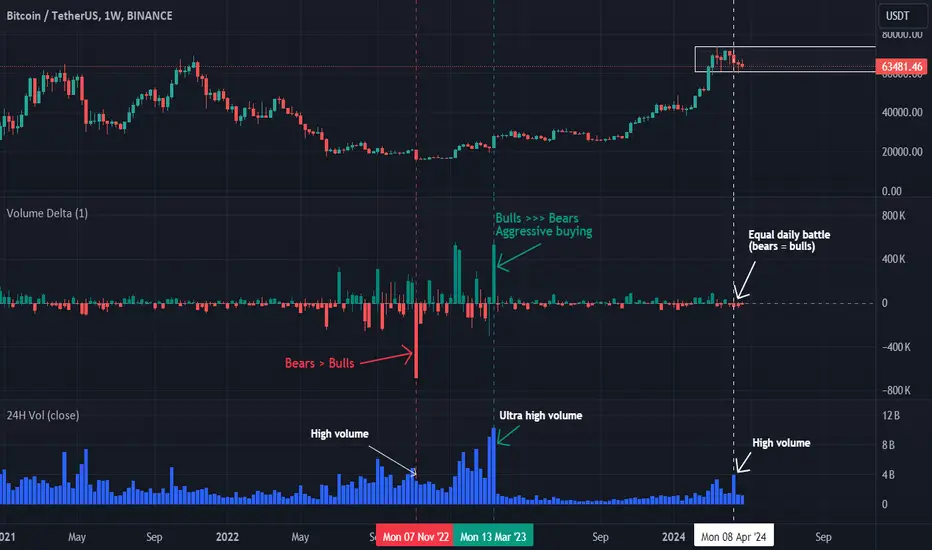
The volume delta indicator serves as a crucial tool for traders, providing insights into the ongoing war between buyers and sellers in the market. 📊 Without it, relying solely on standard volume charts leaves traders blind to who's winning the battle between the bulls 🐻 and the bears🐂 . Moreover, a high volume on its own doesn't necessarily signify a dominant presence of either bulls or bears. Sometimes, amidst the roar of high volumes, the battle is evenly matched, leaving traders unable to discern the potential direction of the market.
Volume Delta indicator shows the net difference between buying and selling volume during the selected timeframe. When the volume delta is positive, it indicates that buying volume is higher than selling volume, suggesting bullish sentiment. Conversely, when the volume delta is negative, it suggests bearish sentiment as selling volume exceeds buying volume.💡
What do spikes in Volume Delta really mean?
If the closing price is far from the upper tail of a green delta volume candle, it suggests that despite the initial surge in buying activity (represented by the tall tail), the price didn't sustain its upward momentum and closed lower. Many examples can be given :
- Buyers bought their coins and sent them to cold wallets
- Presence of liquidation price level or profit taking orders being triggred so Delta volume reached it's maximum.
Traders can use the volume delta indicator to confirm trends, identify potential reversals, and make informed trading decisions based on changes in market dynamics.
Happy learning !
One of the most powerful indicators added by TradingView recently is the Volume Delta indicator.
Practical Explanations :
The volume delta indicator serves as a crucial tool for traders, providing insights into the ongoing war between buyers and sellers in the market. 📊 Without it, relying solely on standard volume charts leaves traders blind to who's winning the battle between the bulls 🐻 and the bears🐂 . Moreover, a high volume on its own doesn't necessarily signify a dominant presence of either bulls or bears. Sometimes, amidst the roar of high volumes, the battle is evenly matched, leaving traders unable to discern the potential direction of the market.
Volume Delta indicator shows the net difference between buying and selling volume during the selected timeframe. When the volume delta is positive, it indicates that buying volume is higher than selling volume, suggesting bullish sentiment. Conversely, when the volume delta is negative, it suggests bearish sentiment as selling volume exceeds buying volume.💡
What do spikes in Volume Delta really mean?
If the closing price is far from the upper tail of a green delta volume candle, it suggests that despite the initial surge in buying activity (represented by the tall tail), the price didn't sustain its upward momentum and closed lower. Many examples can be given :
- Buyers bought their coins and sent them to cold wallets
- Presence of liquidation price level or profit taking orders being triggred so Delta volume reached it's maximum.
Traders can use the volume delta indicator to confirm trends, identify potential reversals, and make informed trading decisions based on changes in market dynamics.
Happy learning !

免责声明
这些信息和出版物并非旨在提供,也不构成TradingView提供或认可的任何形式的财务、投资、交易或其他类型的建议或推荐。请阅读使用条款了解更多信息。
免责声明
这些信息和出版物并非旨在提供,也不构成TradingView提供或认可的任何形式的财务、投资、交易或其他类型的建议或推荐。请阅读使用条款了解更多信息。