
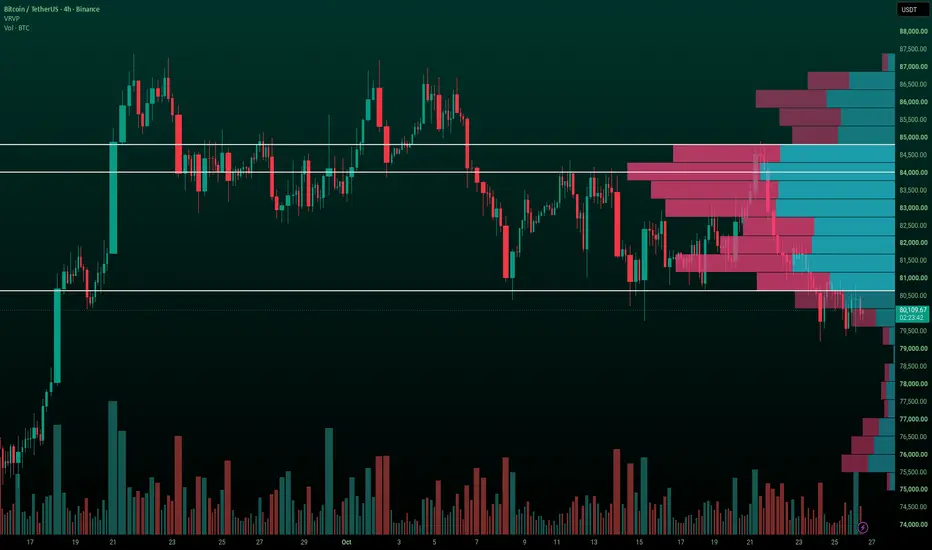
Volume profile shows how much trading happened at each price, instead of over time. That makes it a useful tool for beginners who want to see where the market has actually done business. On this Bitcoin 4h chart I used the visible range volume profile and marked three levels exactly as they appear.
The point of control, or POC, is the price with the most traded volume. Think of it as the market's fair price. Price often gravitates back toward it, so it acts more like a magnet than a wall.
The value area is the zone where most of the volume traded, usually around seventy percent. The value area high, or VAH, is the top edge of that zone. The value area low, or VAL, is the bottom edge.
How price tends to react: inside the value area, price often rotates and chops sideways because buyers and sellers roughly agree on value. At the VAH and VAL, price may stall, reject, or briefly push through. If price leaves the area and holds outside it, the market may be accepting a new value. If it slips back inside, the move often fades toward the POC.
Risk tip: decide your invalidation before entering. Know the point where your idea is wrong, and size your position so that being wrong is acceptable.
Educational only, not financial advice.
The point of control, or POC, is the price with the most traded volume. Think of it as the market's fair price. Price often gravitates back toward it, so it acts more like a magnet than a wall.
The value area is the zone where most of the volume traded, usually around seventy percent. The value area high, or VAH, is the top edge of that zone. The value area low, or VAL, is the bottom edge.
How price tends to react: inside the value area, price often rotates and chops sideways because buyers and sellers roughly agree on value. At the VAH and VAL, price may stall, reject, or briefly push through. If price leaves the area and holds outside it, the market may be accepting a new value. If it slips back inside, the move often fades toward the POC.
Risk tip: decide your invalidation before entering. Know the point where your idea is wrong, and size your position so that being wrong is acceptable.
Educational only, not financial advice.

Apex Gate Pro | Directional Confluence Engine
Access & Info: dfvgroup.co
Access & Info: dfvgroup.co
免责声明
这些信息和出版物并非旨在提供,也不构成TradingView提供或认可的任何形式的财务、投资、交易或其他类型的建议或推荐。请阅读使用条款了解更多信息。
Apex Gate Pro | Directional Confluence Engine
Access & Info: dfvgroup.co
Access & Info: dfvgroup.co
免责声明
这些信息和出版物并非旨在提供,也不构成TradingView提供或认可的任何形式的财务、投资、交易或其他类型的建议或推荐。请阅读使用条款了解更多信息。