
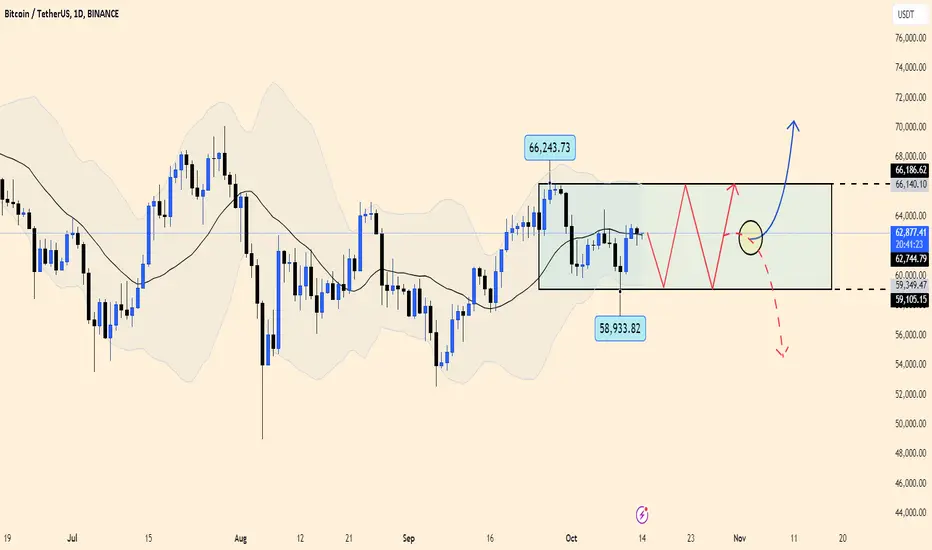
The chart illustrates a sideways movement, with Bitcoin’s price fluctuating within a range defined by the upper and lower bands of the Bollinger Bands. The support and resistance levels are clearly marked around $58,933.82 and $66,186.62, respectively. The price action is constrained between these limits, indicating a lack of momentum and a consolidation phase.
The EMA 34 and 89 are showing weak activity, reflecting the indecisiveness in the market, with no clear signs of a breakout either upwards or downwards. Until the EMAs show a stronger trend signal, the market is likely to remain in this sideways range.
In conclusion, the market is in a consolidation phase, and traders should wait for a breakout from the Bollinger Bands for a clearer direction.
The EMA 34 and 89 are showing weak activity, reflecting the indecisiveness in the market, with no clear signs of a breakout either upwards or downwards. Until the EMAs show a stronger trend signal, the market is likely to remain in this sideways range.
In conclusion, the market is in a consolidation phase, and traders should wait for a breakout from the Bollinger Bands for a clearer direction.

相关出版物
免责声明
这些信息和出版物并非旨在提供,也不构成TradingView提供或认可的任何形式的财务、投资、交易或其他类型的建议或推荐。请阅读使用条款了解更多信息。