
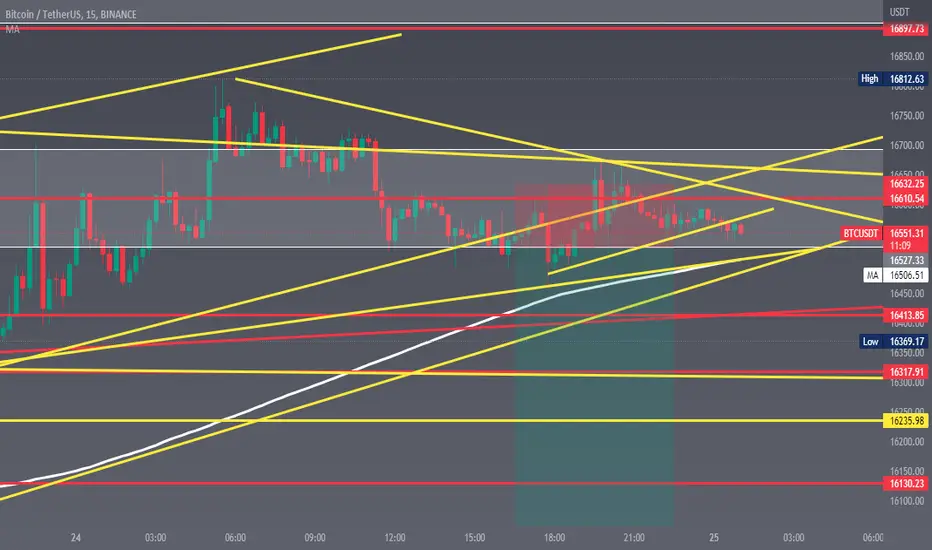
BTC New Target
Bear vs Bull
Once again we look at Bitcoin (XBT) short-term.
We have a recent bullish move... What happens next?
Above the blue and grey lines the bullish move can continue.
Immediate resistance is also found at the black line or MA200 ($16,483).
Looking at these three levels, XBT needs to move above the $16,500/$16,850 price range to knock out the bears.
Any trading below the blue line (~$16,615) can keep the bears alive and the drop resume.
If this level are conquered, then the balls passes towards the bulls.
More details on the chart.
Still red...
Namaste.

免责声明
这些信息和出版物并非旨在提供,也不构成TradingView提供或认可的任何形式的财务、投资、交易或其他类型的建议或推荐。请阅读使用条款了解更多信息。
免责声明
这些信息和出版物并非旨在提供,也不构成TradingView提供或认可的任何形式的财务、投资、交易或其他类型的建议或推荐。请阅读使用条款了解更多信息。