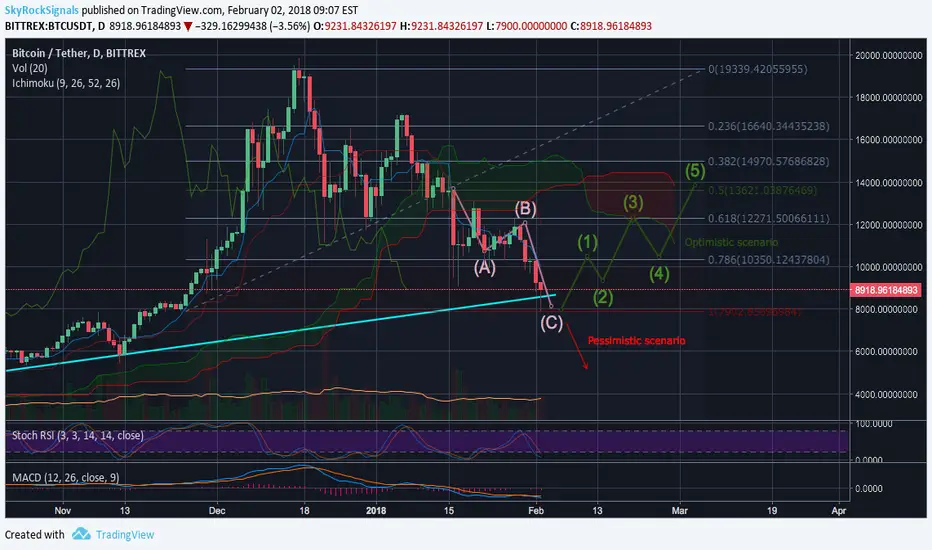
On the 1 day timeframe chart we can see that BTC is in a critical stage. The price touched Fib 1 support level and bounced back, now it is above the trend line again. MACD and RSI both indicate further growth, nevertheless indicator analysis never predicted BTC price movement. Whales understand that if the price goes below the trend line it will break support level and will go much lower. It is not in their interests so they should help it to consolidate and to go to the previous levels. Two possible scenarios are drawn on the chart. Which scenario is more likely to happen we will see in the end of this day. If trades close higher that it opened today then the optimistic scenario should take place otherwise we will see a greater correction wave.

免责声明
这些信息和出版物并非旨在提供,也不构成TradingView提供或认可的任何形式的财务、投资、交易或其他类型的建议或推荐。请阅读使用条款了解更多信息。