
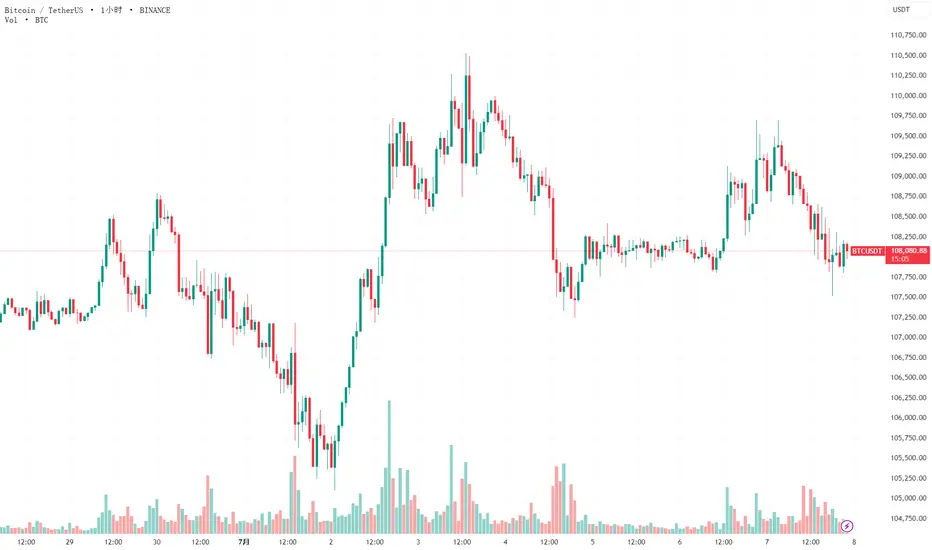
Based on the analysis of recent Bitcoin (BTC) price charts and technical indicators, the following is a speculative outlook for BTC’s near-term price movement, intended for community discussion and brainstorming from a technical analysis perspective.
BTC is currently exhibiting a bullish structure, trading around $108,300 as of July 7, 2025, with strong support from the 50-day and 200-day moving averages, both sloping upward, indicating sustained positive momentum. The Relative Strength Index (RSI) is at 57.63, suggesting a neutral to slightly bullish sentiment, with no immediate overbought conditions. The price is approaching a key resistance zone around $110,000, which has historically capped upward moves. A breakout above this level could signal further upside.
**Price Prediction**: If BTC breaks and holds above $110,000 with high trading volume, it could target $120,000 in the short term, driven by bullish momentum and institutional buying interest. However, failure to break this resistance may lead to consolidation or a pullback to the $95,000–$100,000 support zone.
**Trading Strategy**:
- **Entry Position**: Consider entering a long position at $108,500–$109,000 if the price consolidates and shows a bullish reversal pattern (e.g., inverse head and shoulders or a higher low) near current levels. Alternatively, wait for a confirmed breakout above $110,000 with a retest of this level as support.
- **Take Profit**: Set a take-profit target at $118,000–$120,000, where resistance may emerge based on historical price action and Fibonacci extensions.
- **Stop Loss**: Place a stop-loss order at $104,000 to manage risk, as a drop below this level could signal a deeper correction toward $95,000.
BTC is currently exhibiting a bullish structure, trading around $108,300 as of July 7, 2025, with strong support from the 50-day and 200-day moving averages, both sloping upward, indicating sustained positive momentum. The Relative Strength Index (RSI) is at 57.63, suggesting a neutral to slightly bullish sentiment, with no immediate overbought conditions. The price is approaching a key resistance zone around $110,000, which has historically capped upward moves. A breakout above this level could signal further upside.
**Price Prediction**: If BTC breaks and holds above $110,000 with high trading volume, it could target $120,000 in the short term, driven by bullish momentum and institutional buying interest. However, failure to break this resistance may lead to consolidation or a pullback to the $95,000–$100,000 support zone.
**Trading Strategy**:
- **Entry Position**: Consider entering a long position at $108,500–$109,000 if the price consolidates and shows a bullish reversal pattern (e.g., inverse head and shoulders or a higher low) near current levels. Alternatively, wait for a confirmed breakout above $110,000 with a retest of this level as support.
- **Take Profit**: Set a take-profit target at $118,000–$120,000, where resistance may emerge based on historical price action and Fibonacci extensions.
- **Stop Loss**: Place a stop-loss order at $104,000 to manage risk, as a drop below this level could signal a deeper correction toward $95,000.

免责声明
这些信息和出版物并非旨在提供,也不构成TradingView提供或认可的任何形式的财务、投资、交易或其他类型的建议或推荐。请阅读使用条款了解更多信息。
免责声明
这些信息和出版物并非旨在提供,也不构成TradingView提供或认可的任何形式的财务、投资、交易或其他类型的建议或推荐。请阅读使用条款了解更多信息。