做多
BitShares BTSBTC - Long Setup D1
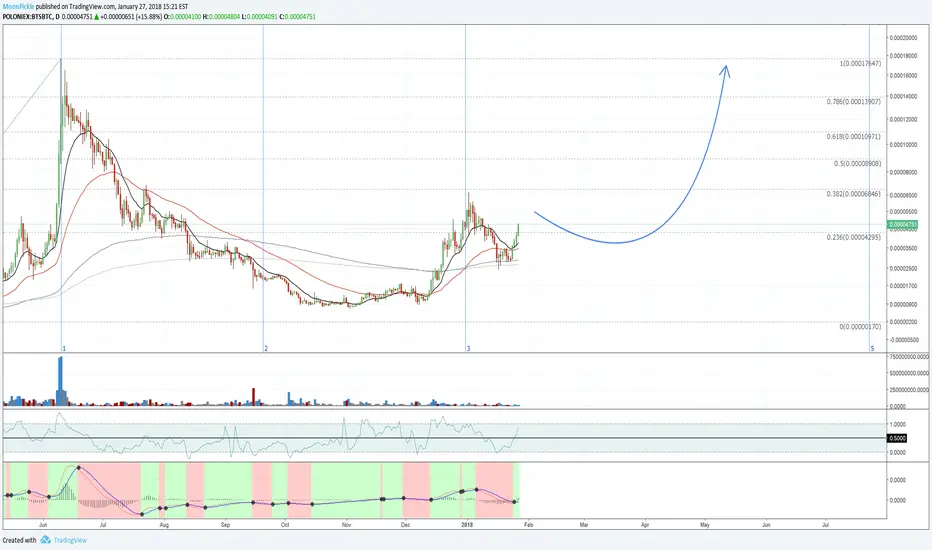
Use fib lines as targets - both time and price analysis are available on the chart.
Measure fib zone 1 to fib zone 2 to determine a time estimate for the formation on the right side of the cup chart pattern within fib zone 3 to fib zone 5.
RSI shows plenty of action on the upper +50 range, indicating bullish bias.
MACD shows fresh momentum.
No volume divergence.
Double bottom pattern shows minor correction is done.
EMA bounce up, no cross.
READY TO GO.
Measure fib zone 1 to fib zone 2 to determine a time estimate for the formation on the right side of the cup chart pattern within fib zone 3 to fib zone 5.
RSI shows plenty of action on the upper +50 range, indicating bullish bias.
MACD shows fresh momentum.
No volume divergence.
Double bottom pattern shows minor correction is done.
EMA bounce up, no cross.
READY TO GO.
交易开始
注释
buy the break out, when price action leaves/breaks the downward channel (moving up)注释
leaving the buy box注释
BOOM注释
fractals on 4H注释
btc correction took bts with it, a double bottom has appeared on 4H订单已取消
btc
免责声明
这些信息和出版物并非旨在提供,也不构成TradingView提供或认可的任何形式的财务、投资、交易或其他类型的建议或推荐。请阅读使用条款了解更多信息。
免责声明
这些信息和出版物并非旨在提供,也不构成TradingView提供或认可的任何形式的财务、投资、交易或其他类型的建议或推荐。请阅读使用条款了解更多信息。