BTS bounce.
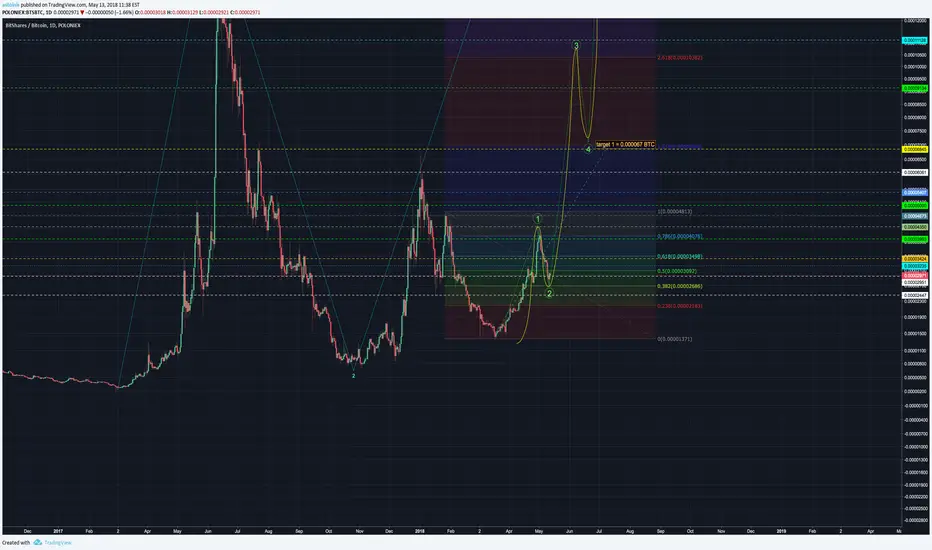
the waves labeled is a chart for reference, using the initial high of last years June price as greater Wave 1, the correction that ensued thus far as wave 2, and where we are is the beginning of wave 3 of 3.
not sure of time table, but the price projection is using a minimum of 1.1618 times the length of wave 1 to calculate the minimum price movement we could expect for wave 3.
and then using the height of wave 1, to be in a 1:1 correlation of wave 5.
gooooo bitshares
not sure of time table, but the price projection is using a minimum of 1.1618 times the length of wave 1 to calculate the minimum price movement we could expect for wave 3.
and then using the height of wave 1, to be in a 1:1 correlation of wave 5.
gooooo bitshares

免责声明
这些信息和出版物并非旨在提供,也不构成TradingView提供或认可的任何形式的财务、投资、交易或其他类型的建议或推荐。请阅读使用条款了解更多信息。