
WEEKLY CHART

DAILY CHART

Main Support Lines
$136.38
$57.55
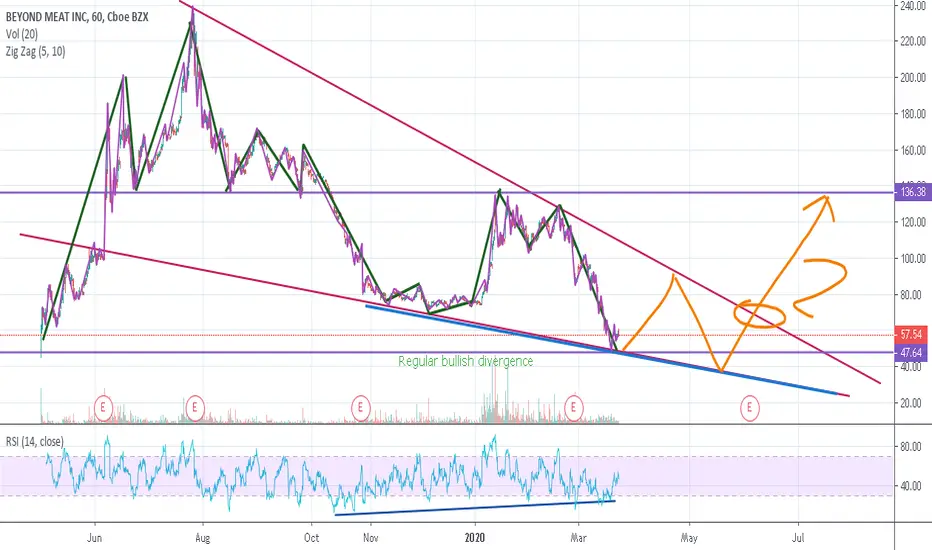
As we can three in the weekly, daily, 1-hour chart of Beyond meat we can see 2 main thing. First the falling wedge and second a regular bullish divergence.
1. Falling Wedge
We can see it clearly in all the charts forming with the 2 main trendlines forming it with the purple colour.
2.Divergence
We can spot the 1st divergence in the daily chart with the blue colour when as price dropping the rsi indicator is rising. The same thing we can see in the 1-hour price chart
SCENARIO
Both the falling wedge and the regular bullish divergence indicates that in sometime the price will break the wedge with breakout, and ultimate go to the support at 136$
DAILY CHART
Main Support Lines
$136.38
$57.55
As we can three in the weekly, daily, 1-hour chart of Beyond meat we can see 2 main thing. First the falling wedge and second a regular bullish divergence.
1. Falling Wedge
We can see it clearly in all the charts forming with the 2 main trendlines forming it with the purple colour.
2.Divergence
We can spot the 1st divergence in the daily chart with the blue colour when as price dropping the rsi indicator is rising. The same thing we can see in the 1-hour price chart
SCENARIO
Both the falling wedge and the regular bullish divergence indicates that in sometime the price will break the wedge with breakout, and ultimate go to the support at 136$
注释
Testing the strong resistance at 136$. lets see how it will go
免责声明
这些信息和出版物并非旨在提供,也不构成TradingView提供或认可的任何形式的财务、投资、交易或其他类型的建议或推荐。请阅读使用条款了解更多信息。
免责声明
这些信息和出版物并非旨在提供,也不构成TradingView提供或认可的任何形式的财务、投资、交易或其他类型的建议或推荐。请阅读使用条款了解更多信息。