
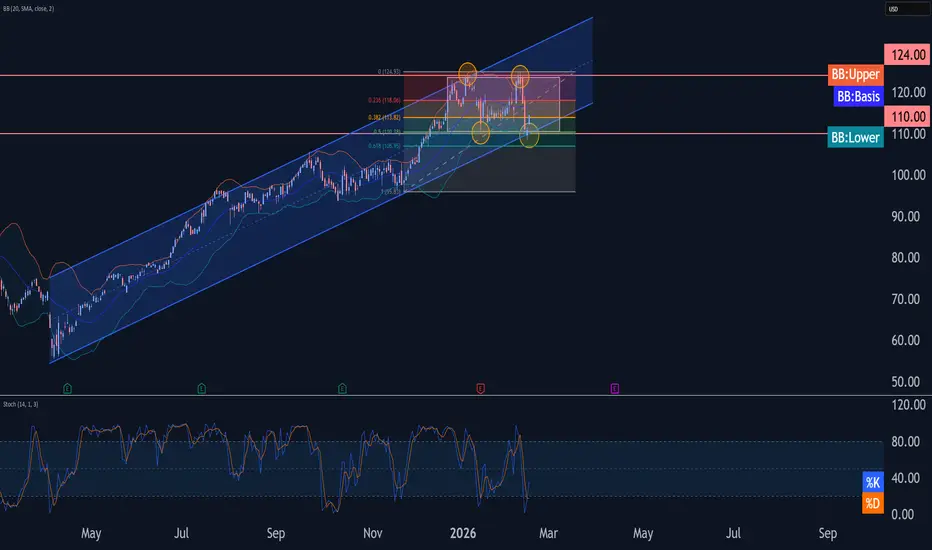
- Citibank reversed from key support level 110.00
- Likely to rise to resistance level 124.00
Citibank recently reversed up from the support area between the key support level 110.00 (lower border of the sideways price range from December), lower daily Bollinger Band and the 50% Fibonacci correction of the upward impulse from November.
The support zone near the support level 110.00 was strengthened by the support trendline of the weekly up channel from April of 2025.
Given the overriding daily uptrend, Citibank can be expected to rise to the next resistance level 124.00 (upper border of the active sideways price range).
- Likely to rise to resistance level 124.00
Citibank recently reversed up from the support area between the key support level 110.00 (lower border of the sideways price range from December), lower daily Bollinger Band and the 50% Fibonacci correction of the upward impulse from November.
The support zone near the support level 110.00 was strengthened by the support trendline of the weekly up channel from April of 2025.
Given the overriding daily uptrend, Citibank can be expected to rise to the next resistance level 124.00 (upper border of the active sideways price range).

By the FxPro Analyst Team
Follow our dedicated Telegram channel t.me/fxpro for insightful market analysis and expert commentary.
Reach out to media.comments@fxpro.com for PR and media inquiries
Follow our dedicated Telegram channel t.me/fxpro for insightful market analysis and expert commentary.
Reach out to media.comments@fxpro.com for PR and media inquiries
免责声明
这些信息和出版物并非旨在提供,也不构成TradingView提供或认可的任何形式的财务、投资、交易或其他类型的建议或推荐。请阅读使用条款了解更多信息。
By the FxPro Analyst Team
Follow our dedicated Telegram channel t.me/fxpro for insightful market analysis and expert commentary.
Reach out to media.comments@fxpro.com for PR and media inquiries
Follow our dedicated Telegram channel t.me/fxpro for insightful market analysis and expert commentary.
Reach out to media.comments@fxpro.com for PR and media inquiries
免责声明
这些信息和出版物并非旨在提供,也不构成TradingView提供或认可的任何形式的财务、投资、交易或其他类型的建议或推荐。请阅读使用条款了解更多信息。