
Hey Guys,
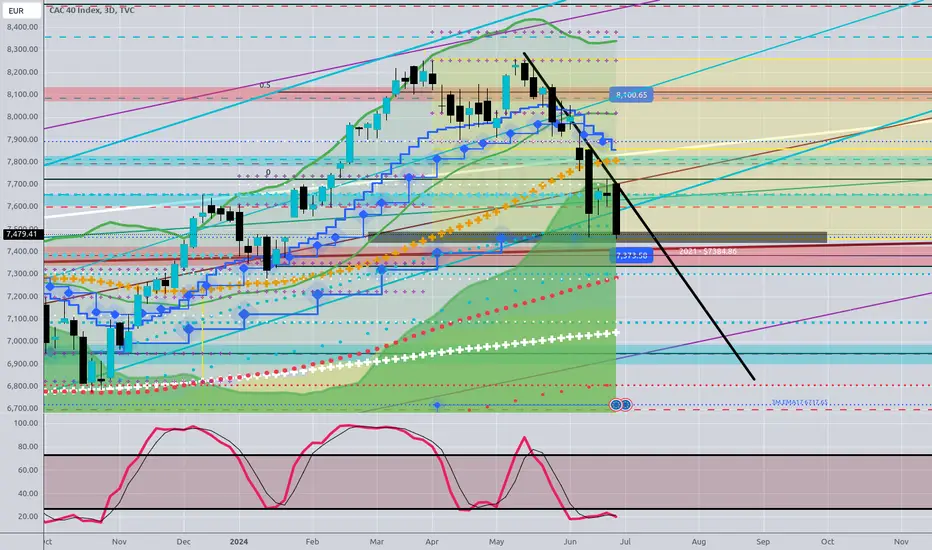
Yearly is bullish - but only above 7660.
Q Chart is Bearish - Bearish Engulfment.
Monthly as Well. Quarterly Stochastic is turning down.
3 Zones to watch: 8100 7650 7373
Monthly candle is testing Bullish Trendline… Bounce expected to form a lower igh below the Double Bottom. -> Bearish Chartpattern
I will look for an Entry on the Hourly Chart.
Thanks for reading
Yearly is bullish - but only above 7660.
Q Chart is Bearish - Bearish Engulfment.
Monthly as Well. Quarterly Stochastic is turning down.
3 Zones to watch: 8100 7650 7373
Monthly candle is testing Bullish Trendline… Bounce expected to form a lower igh below the Double Bottom. -> Bearish Chartpattern
I will look for an Entry on the Hourly Chart.
Thanks for reading

相关出版物
免责声明
这些信息和出版物并非旨在提供,也不构成TradingView提供或认可的任何形式的财务、投资、交易或其他类型的建议或推荐。请阅读使用条款了解更多信息。