

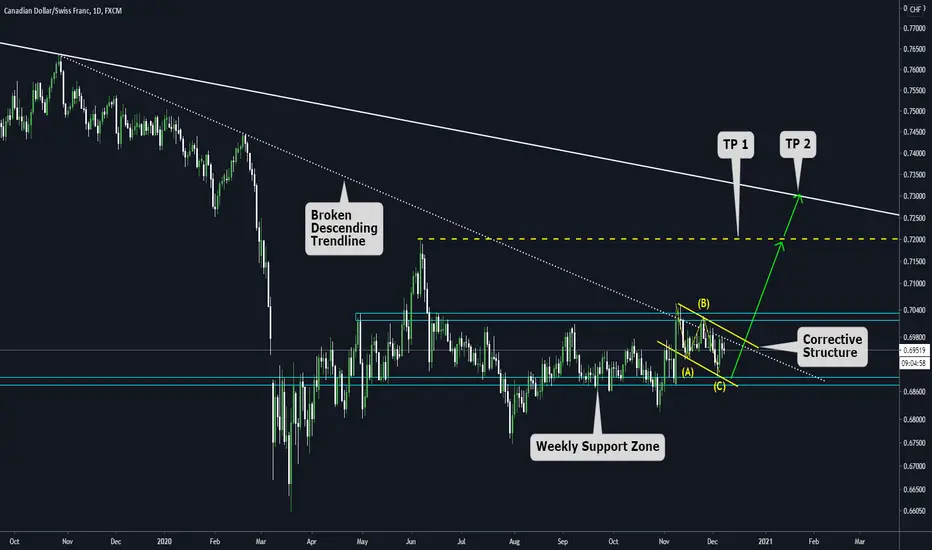
Today, we will show our view on CADCHF based on Daily and weekly timeframes.
Weekly Chart:

The price is on a major support zone, and we saw a clear rejection there. Now we can see a local trendline about to be broken, and we expect a bullish resolution towards the next resistance zone. (Descending Trendline.
Daily Chart:
Here we have a more zoomed view of the Weekly chart, and we can see a corrective structure on the edge of the broken descending trendline. If we have a breakout of the ABC pattern, we expect a continuation movement towards the next resistance zone (TP1) and a Final Target on the Weekly descending trendline (TP2)
Weekly Chart:
The price is on a major support zone, and we saw a clear rejection there. Now we can see a local trendline about to be broken, and we expect a bullish resolution towards the next resistance zone. (Descending Trendline.
Daily Chart:
Here we have a more zoomed view of the Weekly chart, and we can see a corrective structure on the edge of the broken descending trendline. If we have a breakout of the ABC pattern, we expect a continuation movement towards the next resistance zone (TP1) and a Final Target on the Weekly descending trendline (TP2)

免责声明
这些信息和出版物并非旨在提供,也不构成TradingView提供或认可的任何形式的财务、投资、交易或其他类型的建议或推荐。请阅读使用条款了解更多信息。
免责声明
这些信息和出版物并非旨在提供,也不构成TradingView提供或认可的任何形式的财务、投资、交易或其他类型的建议或推荐。请阅读使用条款了解更多信息。