
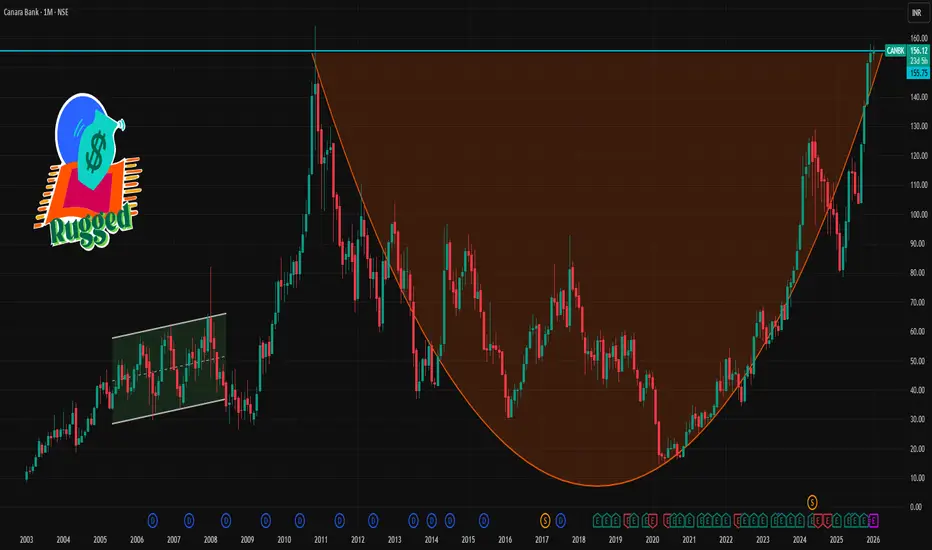
📊 Live Price Snapshot
Current market price: ~₹155 – ₹156 range on NSE.
🔁 1‑Month Key Support & Resistance Levels (based on recent pivot & price data)
📈 Resistance Levels (Upside)
₹156 – ₹157 — Immediate resistance (Pivot + recent highs).
₹157.4 – ₹158.8 — Next resistance zone near recent 52‑week high.
₹160 + — Further upside beyond range expansion (short‑term breakout level).
👉 As long as price remains above ₹156–₹157, short‑term bias stays positive.
📉 Support Levels (Downside)
₹153 – ₹154 — Near short‑term support / pivot collision zone.
₹151.5 – ₹152 — Key short‑term support from Fibonacci/MA area.
₹149 – ₹150 — Deeper support if stocks correct further.
💡 A break below ₹151 could signal mild pullback pressure; staying above ₹154–₹156 keeps the short‑term uptrend intact.
📊 Moving Averages & Trend Signals (1‑Month Context)
Daily & weekly SMAs/EMAs show bullish bias with price above most key moving averages.
RSI (~57) in bullish to neutral territory — not overbought, so room for continuation.
MACD and other momentum readings support mild bullish momentum.
🗒️ What This Means for Traders
✔️ Bullish bias near current levels as long as above the 1st support zone (~₹153–₹154).
✔️ Watch out for pivot breaks:
‑ Below ₹151 for a short‑term pullback,
‑ Above ₹158 for upside continuation.
✔️ Confirm with volume and intraday momentum before major positional decisions.
Current market price: ~₹155 – ₹156 range on NSE.
🔁 1‑Month Key Support & Resistance Levels (based on recent pivot & price data)
📈 Resistance Levels (Upside)
₹156 – ₹157 — Immediate resistance (Pivot + recent highs).
₹157.4 – ₹158.8 — Next resistance zone near recent 52‑week high.
₹160 + — Further upside beyond range expansion (short‑term breakout level).
👉 As long as price remains above ₹156–₹157, short‑term bias stays positive.
📉 Support Levels (Downside)
₹153 – ₹154 — Near short‑term support / pivot collision zone.
₹151.5 – ₹152 — Key short‑term support from Fibonacci/MA area.
₹149 – ₹150 — Deeper support if stocks correct further.
💡 A break below ₹151 could signal mild pullback pressure; staying above ₹154–₹156 keeps the short‑term uptrend intact.
📊 Moving Averages & Trend Signals (1‑Month Context)
Daily & weekly SMAs/EMAs show bullish bias with price above most key moving averages.
RSI (~57) in bullish to neutral territory — not overbought, so room for continuation.
MACD and other momentum readings support mild bullish momentum.
🗒️ What This Means for Traders
✔️ Bullish bias near current levels as long as above the 1st support zone (~₹153–₹154).
✔️ Watch out for pivot breaks:
‑ Below ₹151 for a short‑term pullback,
‑ Above ₹158 for upside continuation.
✔️ Confirm with volume and intraday momentum before major positional decisions.

Contact Knowledgehub for a detailed consultation: Dm on WhatsApp: [wa.link/a2o0kz]-
Phone No: [+91 93102 26243]-
Email: [tradingviewknowledgehub@gmail.com]---
-- Let’s achieve success together!
Phone No: [+91 93102 26243]-
Email: [tradingviewknowledgehub@gmail.com]---
-- Let’s achieve success together!
相关出版物
免责声明
这些信息和出版物并非旨在提供,也不构成TradingView提供或认可的任何形式的财务、投资、交易或其他类型的建议或推荐。请阅读使用条款了解更多信息。
Contact Knowledgehub for a detailed consultation: Dm on WhatsApp: [wa.link/a2o0kz]-
Phone No: [+91 93102 26243]-
Email: [tradingviewknowledgehub@gmail.com]---
-- Let’s achieve success together!
Phone No: [+91 93102 26243]-
Email: [tradingviewknowledgehub@gmail.com]---
-- Let’s achieve success together!
相关出版物
免责声明
这些信息和出版物并非旨在提供,也不构成TradingView提供或认可的任何形式的财务、投资、交易或其他类型的建议或推荐。请阅读使用条款了解更多信息。